Für die, die es schon immer wissen wollten: Ich hatte es nicht im Netz gefunden, daher habe ich die Temperaturen beim Resch&Frisch Ofen selber gemessen. Hier sind die Programme und die dazugehörigen Gradzahlen:

Programm	Temperatur
Programm 1	125° / 130°
Programm 2	190°
Programm 3	180°
Programm 4	170°
Programm 6	160°
Programm 7	160°
Programm 12 240°Category Archives: Allgemein
🧌 What has MonsterMQ become?
I started this as an open-source MQTT broker, to learn MQTT. But somewhere along the way it grew into something bigger…
Connectivity:
🔄 MQTT Bridging
📨 Kafka Bridging
🔌 OPC UA Client & Server
⚙️ PLC4X (PLC connectivity)
🏭 WinCC OA & WinCC Unified Clients
🚀 NATS Client & NATS Protocol Server
Processing & Transformation:
🕸️ Neo4J integration
⚡ SparkplugB Decoder
🔄 Workflows for data transformation
🕸️ Clustered and distributed setup
Archiving & Storage:
💾 Last value storage: in-memory and databases, infinite retained messages
🗄️ Internal database archiving: MongoDB, Postgres, Timescale, SQLite
❄️ Logging to QuestDB, MySQL, Postgres, Timescale, Snowflake
APIs & Interfaces:
🔍 GraphQL
📡 MQTT API
🤖 MCP Server
📊 Prometheus
🏭 i3x / CESMII
🔜 REST API — coming soon!
An integrated topic browser, visualizer, and AI analyzer. 💡
👉 MonsterMQ.com
MQTT Broker with i3x? – MonsterMQ got it!
A i3x server integrated directly into MonsterMQ!
What’s happening under the hood:
👉 MQTT topics are stored in memory
👉 Historical values are persisted in MongoDB
Those features have been available in MonsterMQ for a long time…
The i3x interface just exposes all of that data via the i3x protocol!
💡 This means you get a full MQTT broker with structured, queryable data access via i3x – all in one place.
WhatsApp messages from WinCC Unified
Someone asked me if it’s possible to send WhatsApp messages from WinCC Unified 💬
Yes, and it’s simple! A small Python helper connects to the GraphQL server of WinCC Unified, subscribes to a tag to get the message text, and forwards it to WhatsApp via Twilio. That’s it. And for sure, the same can be done with WinCC Open Architecture.
Available here: https://github.com/vogler75/winccua-twilio
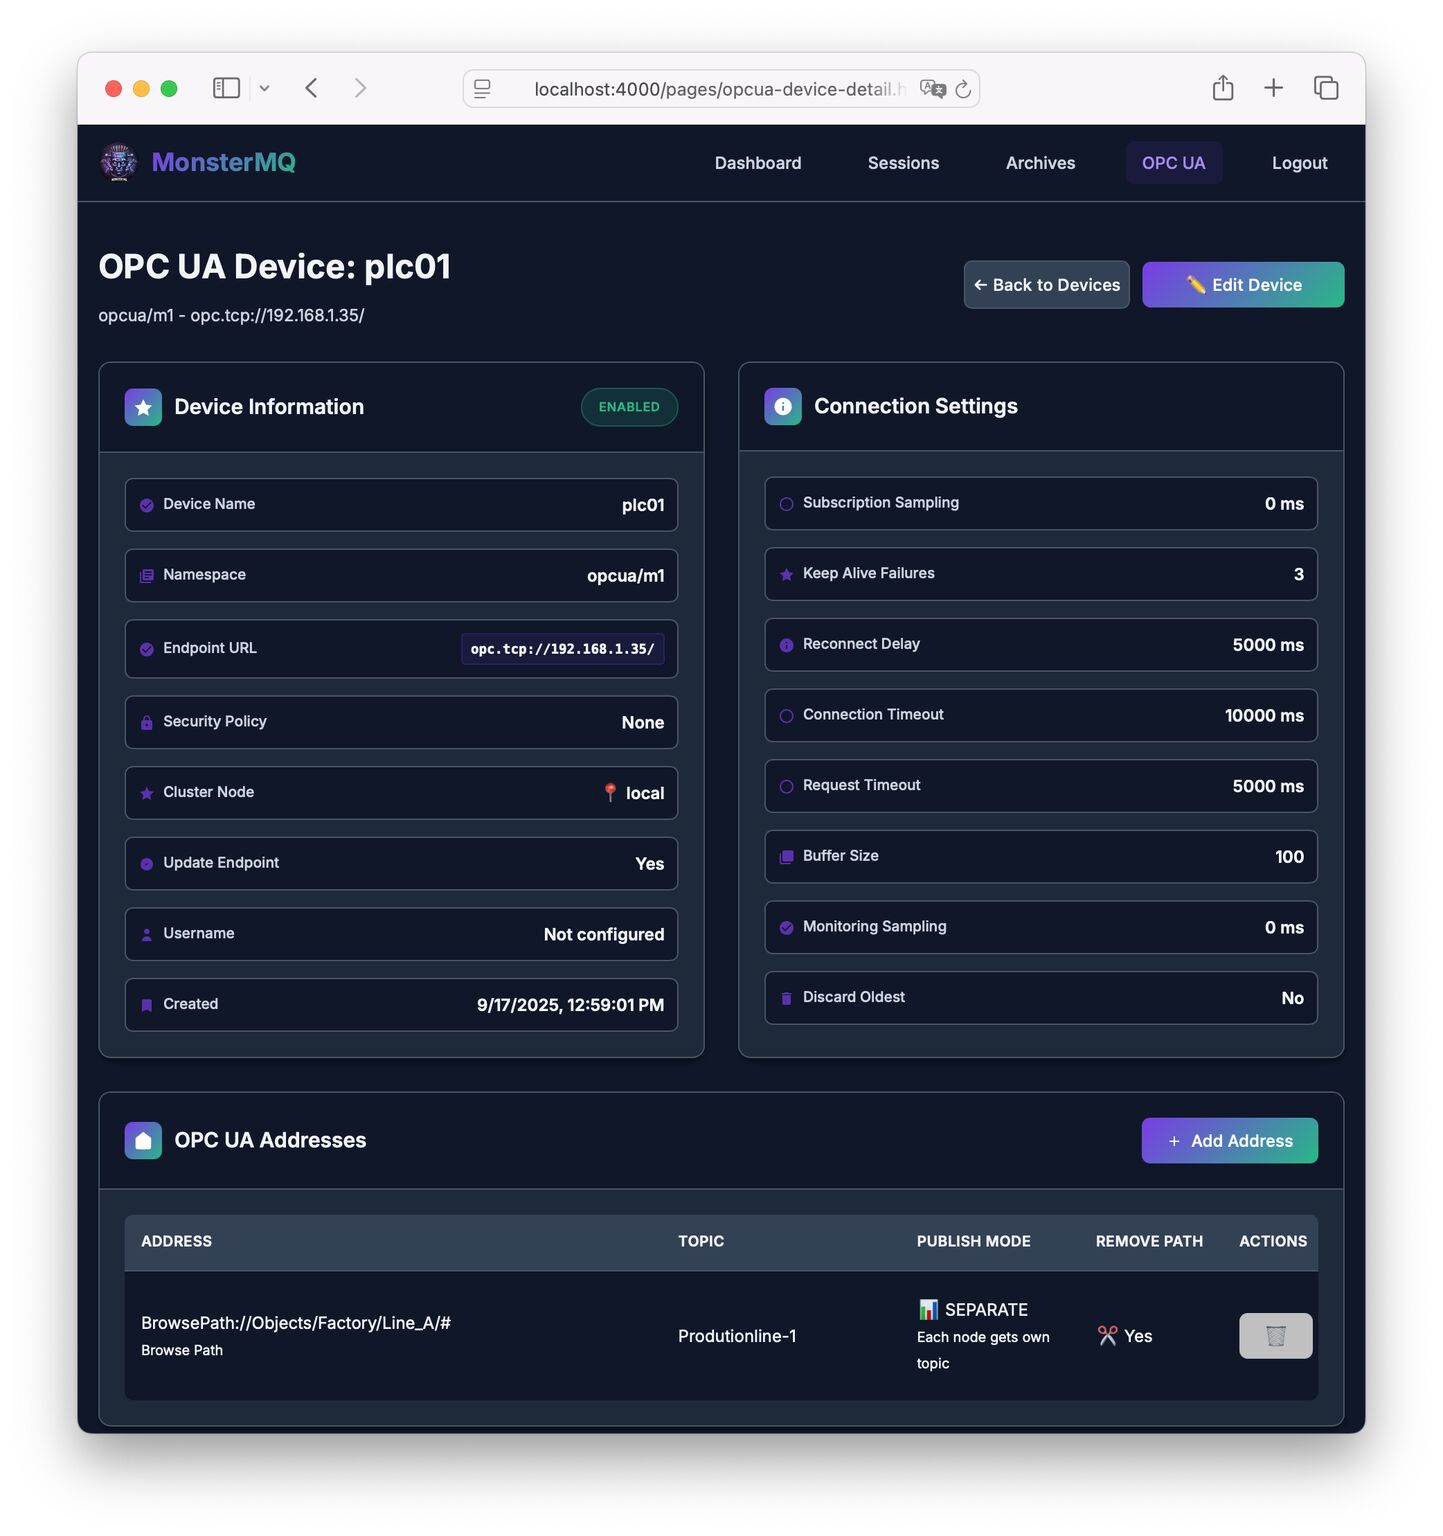
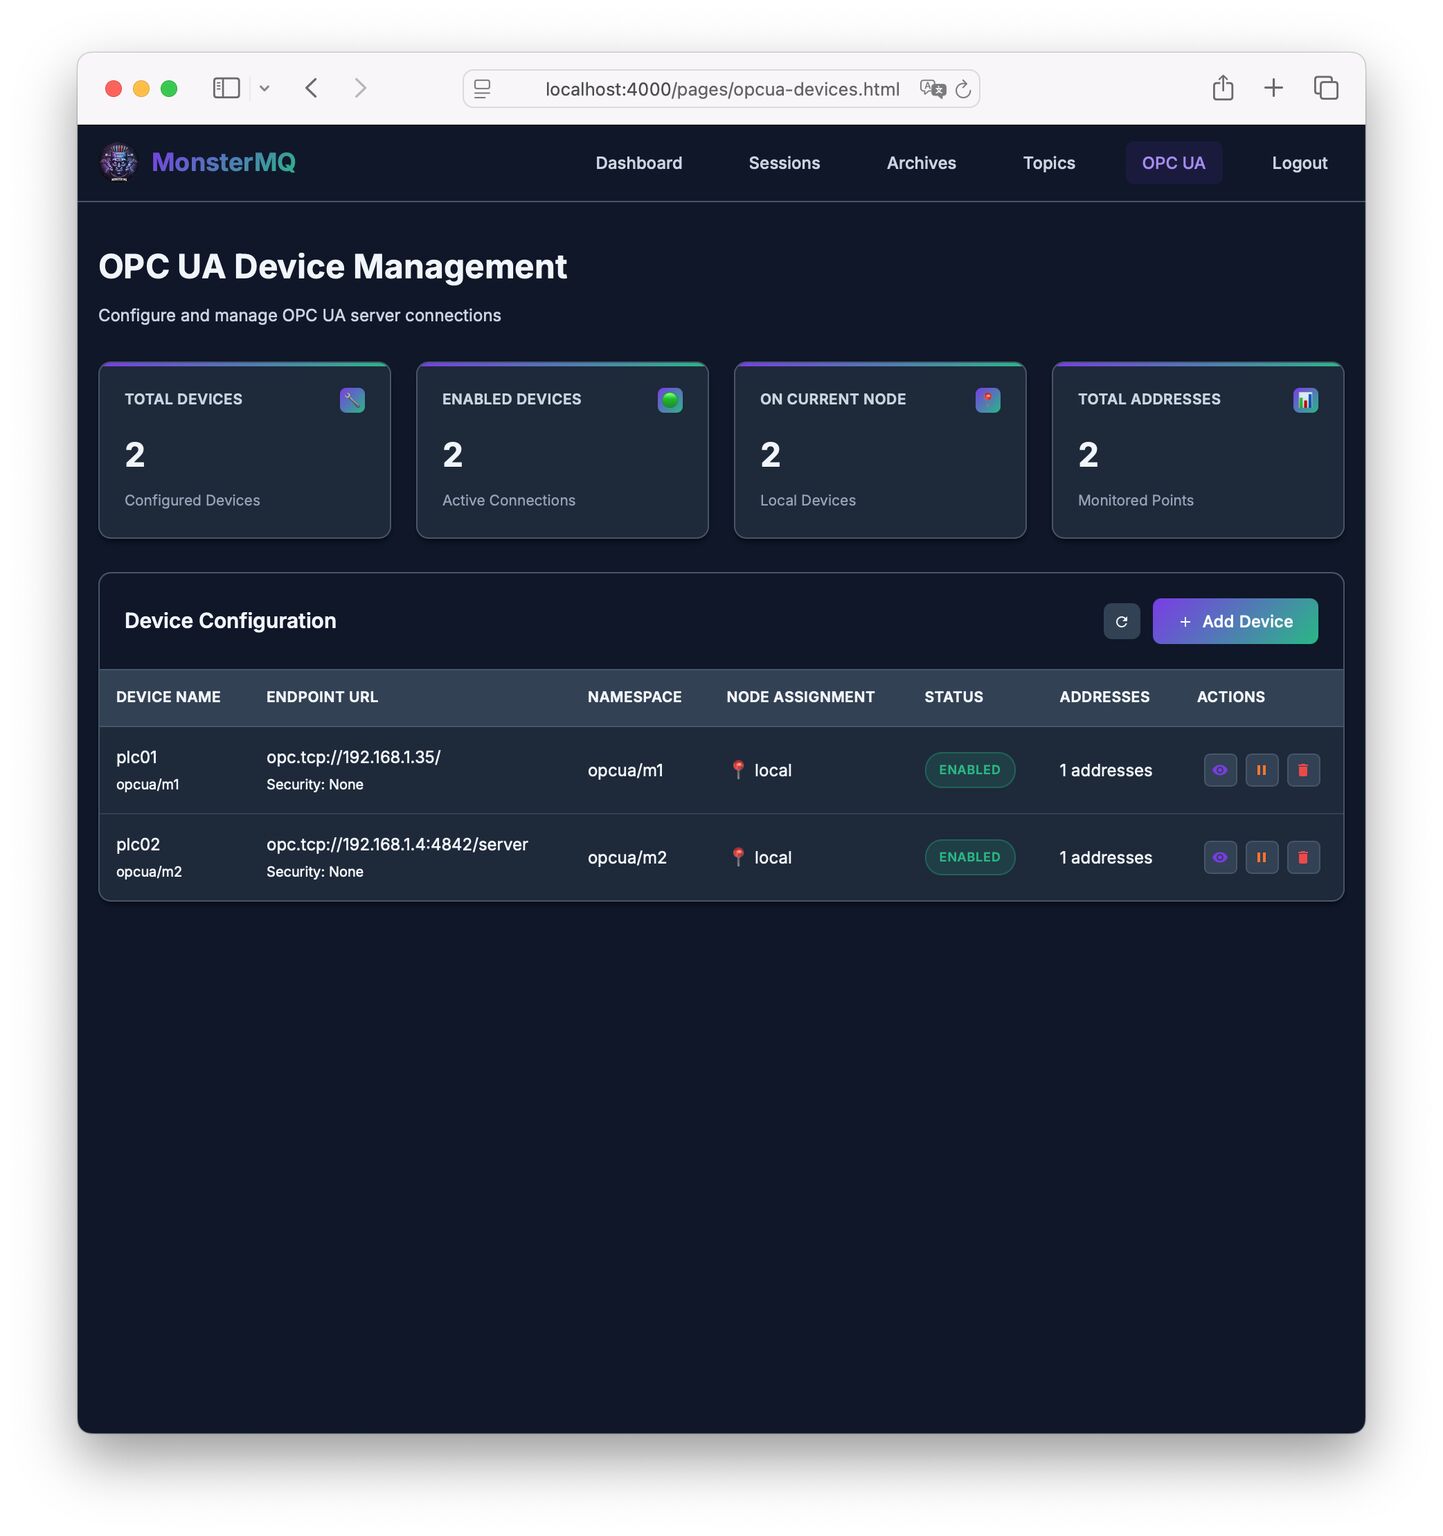
🚀 Nightly new Feature in MonsterMQ: OPC UA Server Connectivity!
With this integration, MonsterMQ can now connect directly to OPC UA Servers and make the data available on MQTT topics — bridging two key industrial protocols.
Plus we have integrated a topic tree browser, see pics!
I took a half day off work, to finish this.
🔗 https://monstermq.com – Open-Source 👍
👉 Star it on GitHub if you like it!


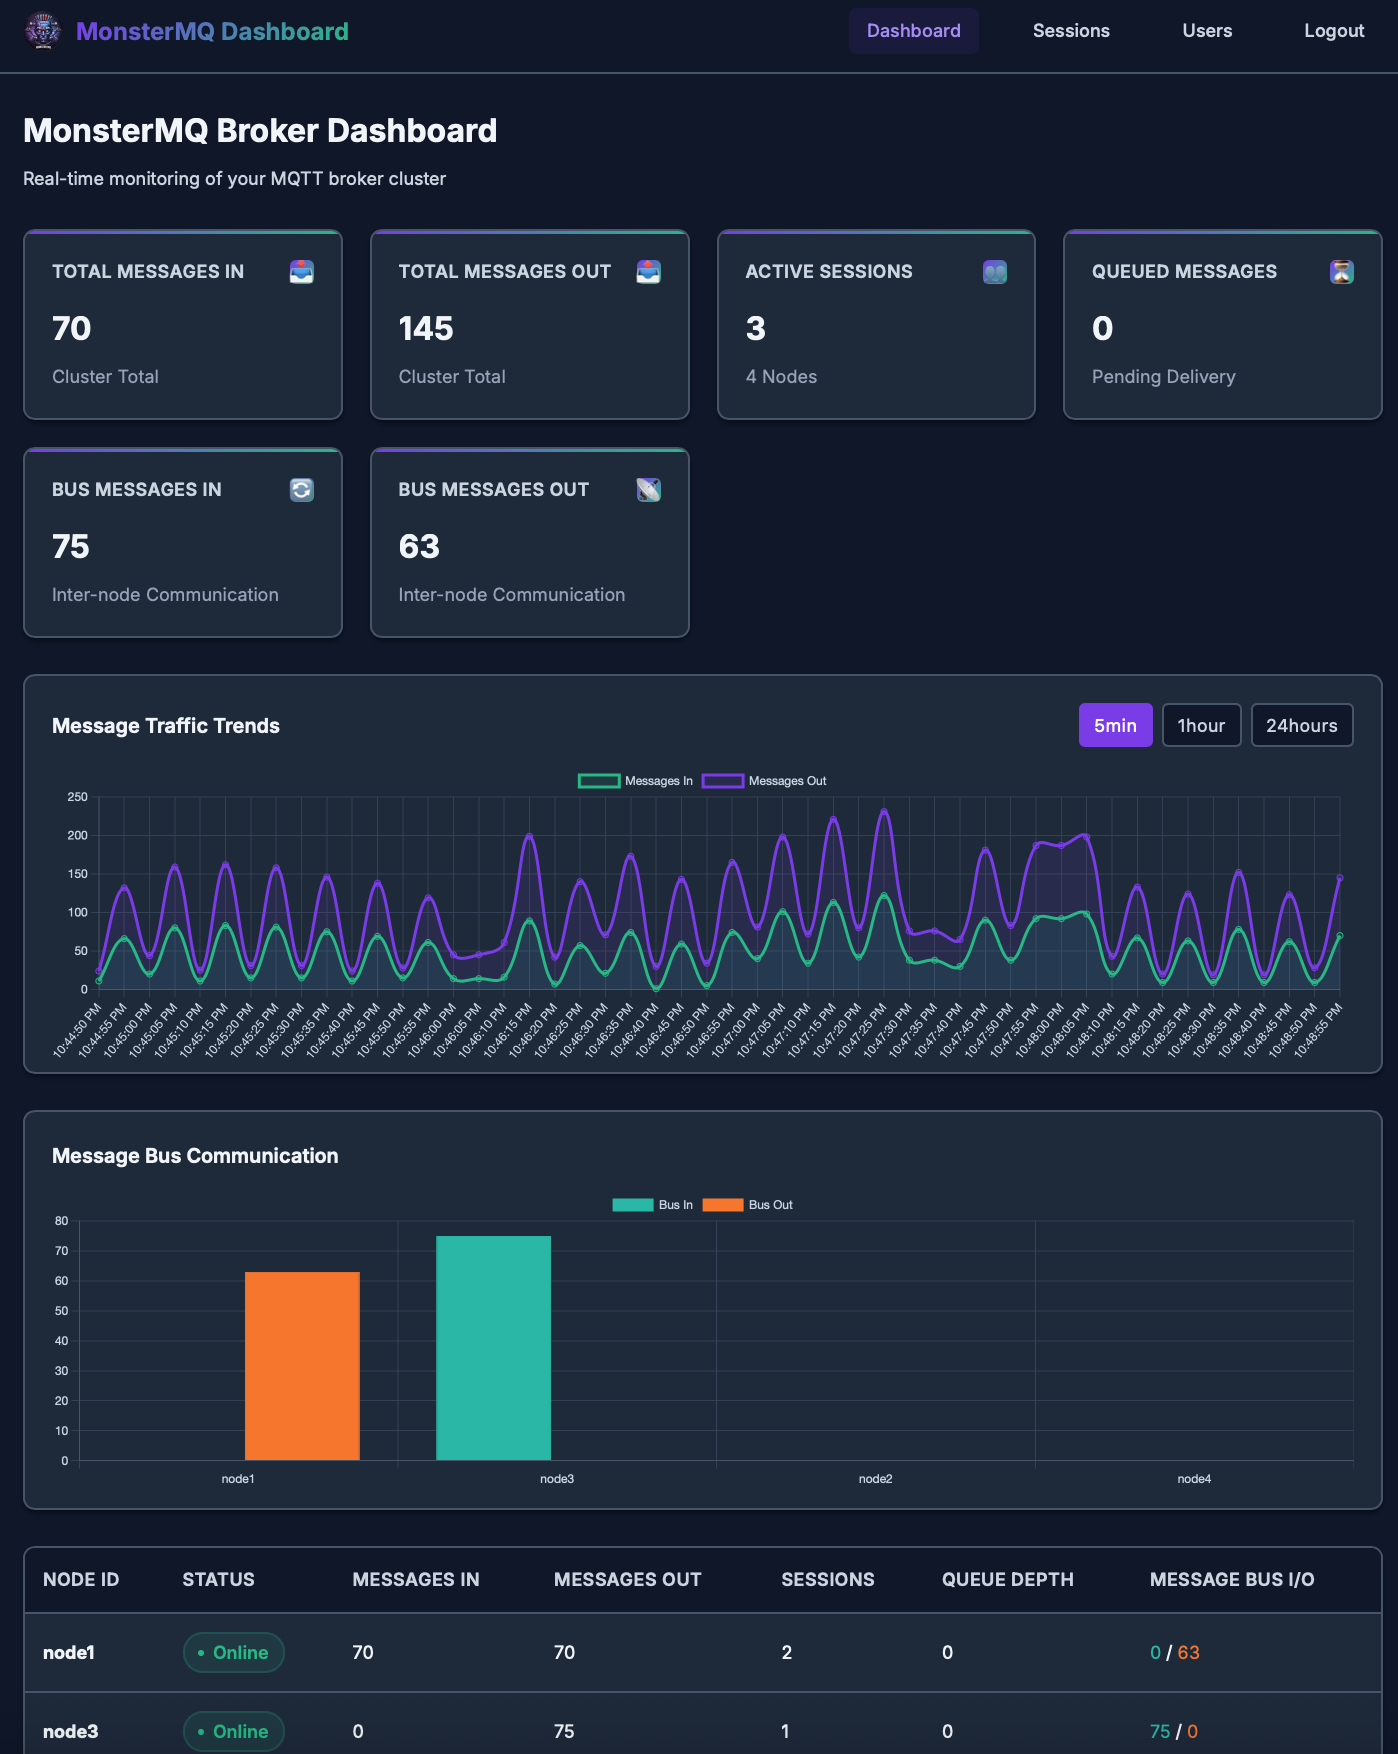
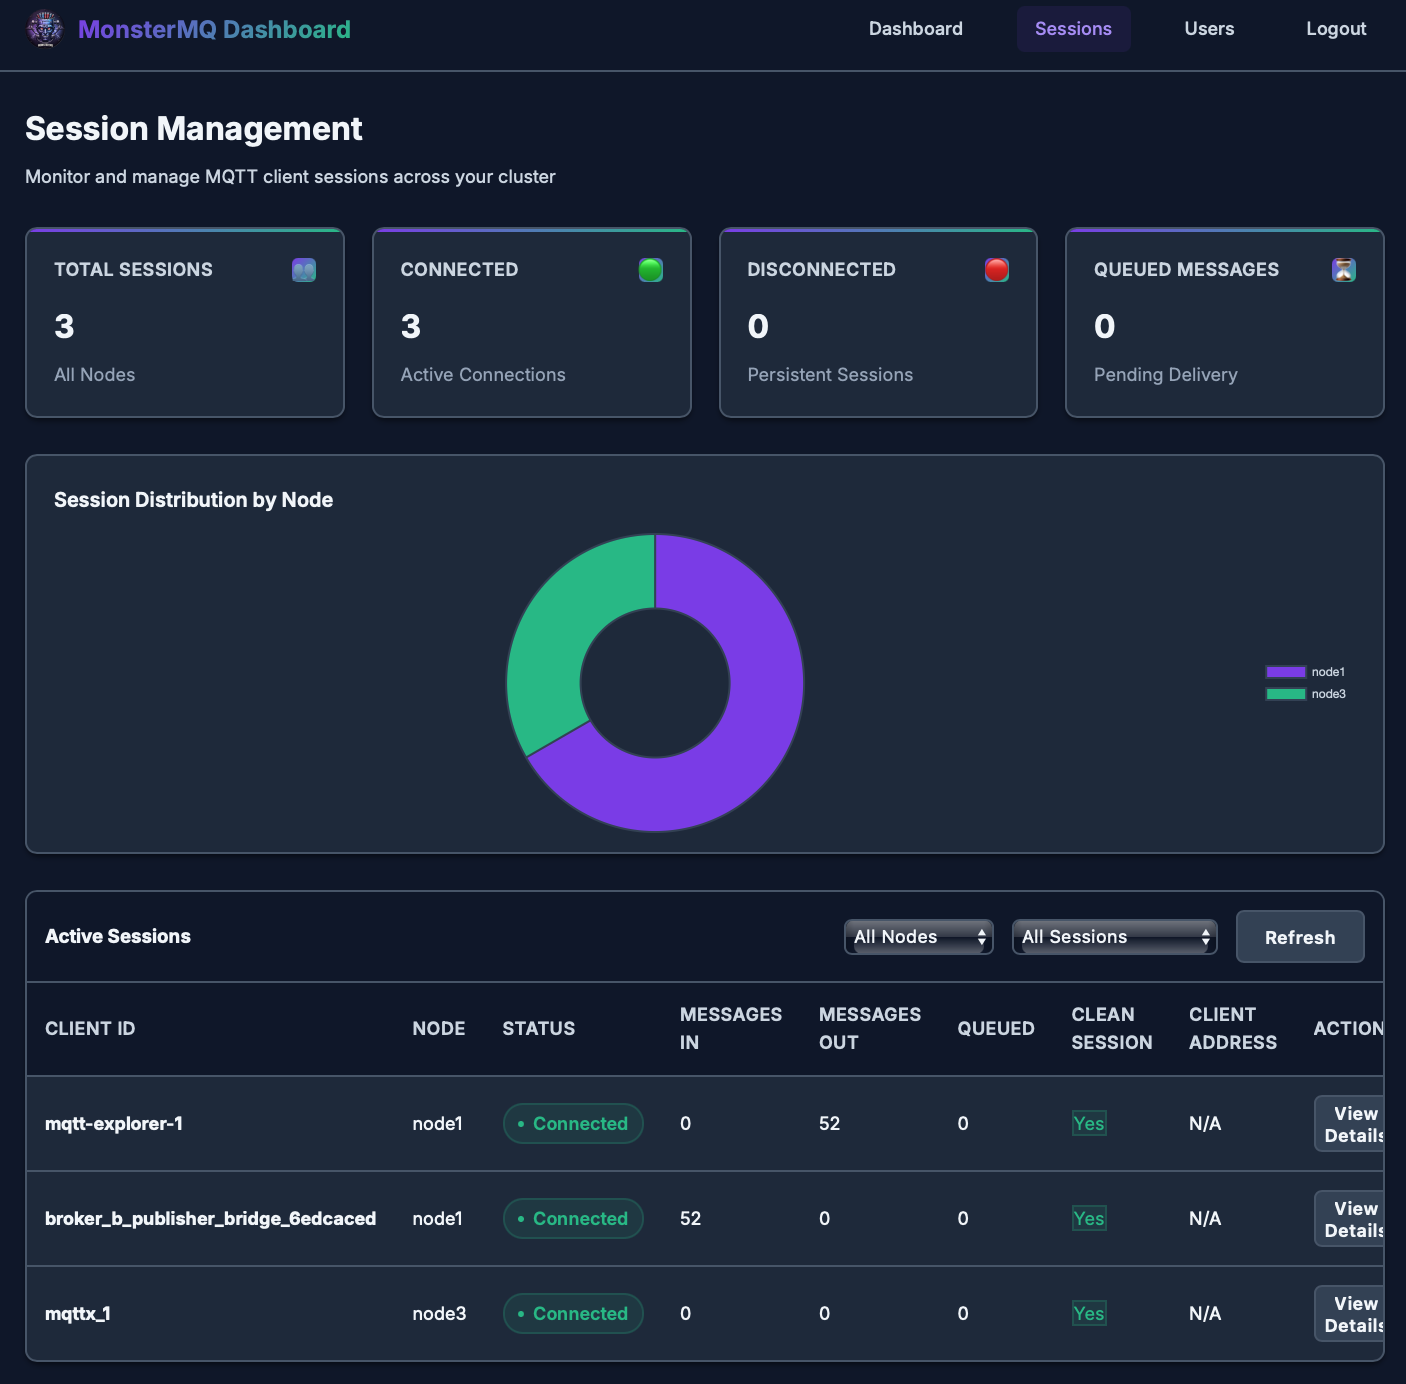
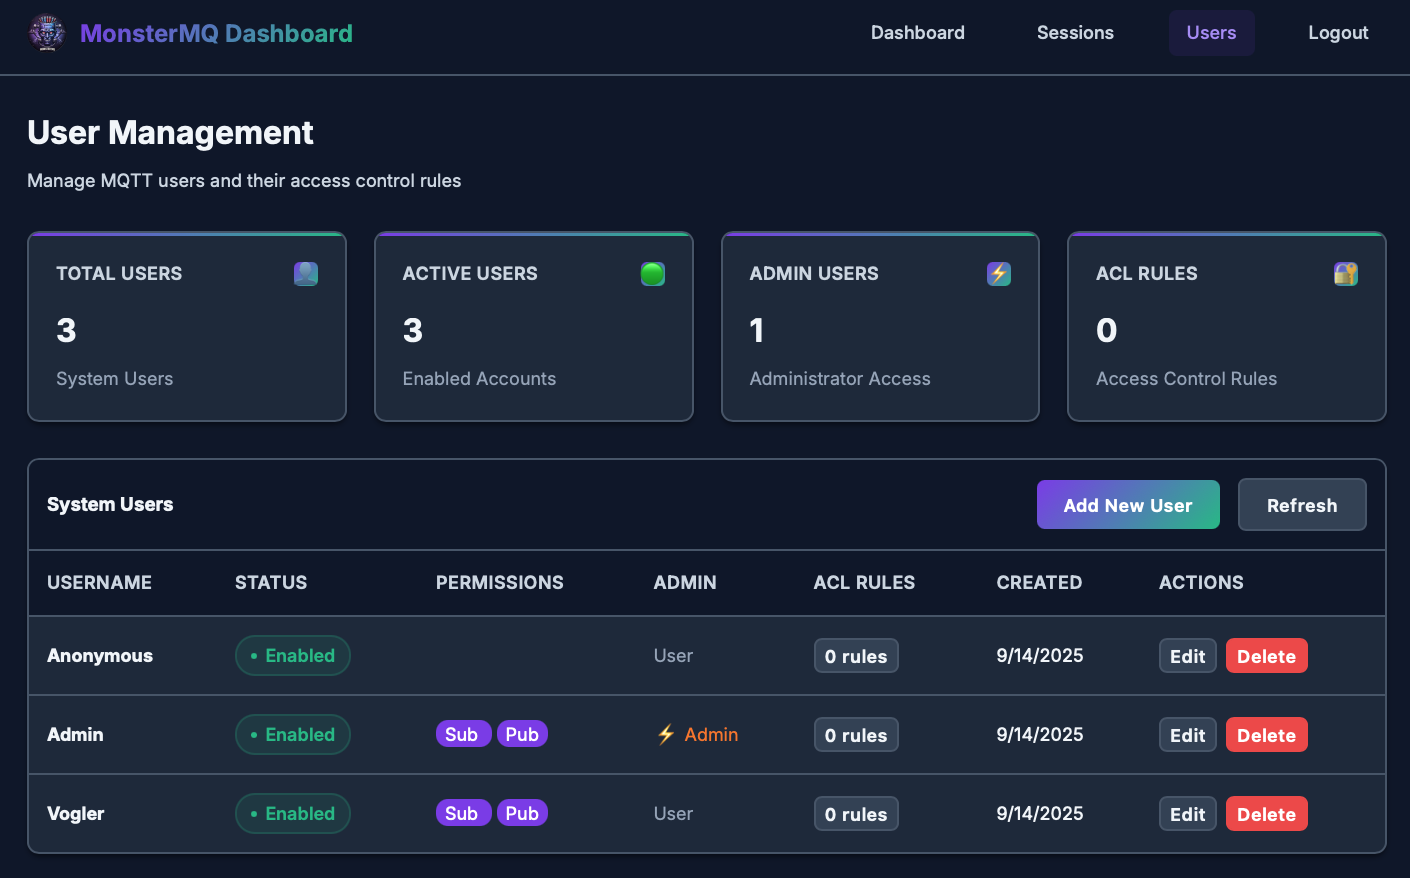
🧌 The Monster got a face: Dashboard for MonsterMQ
From the new dashboard pages, you can now:
👉 Monitor node & cluster activity
👉 Monitor connected sessions
👉 Manage users and ACLs
There is also a new homepage for MonsterMQ
👉 https://monstermq.com
The dashboard is powered by MonsterMQ Broker’s GraphQL API.
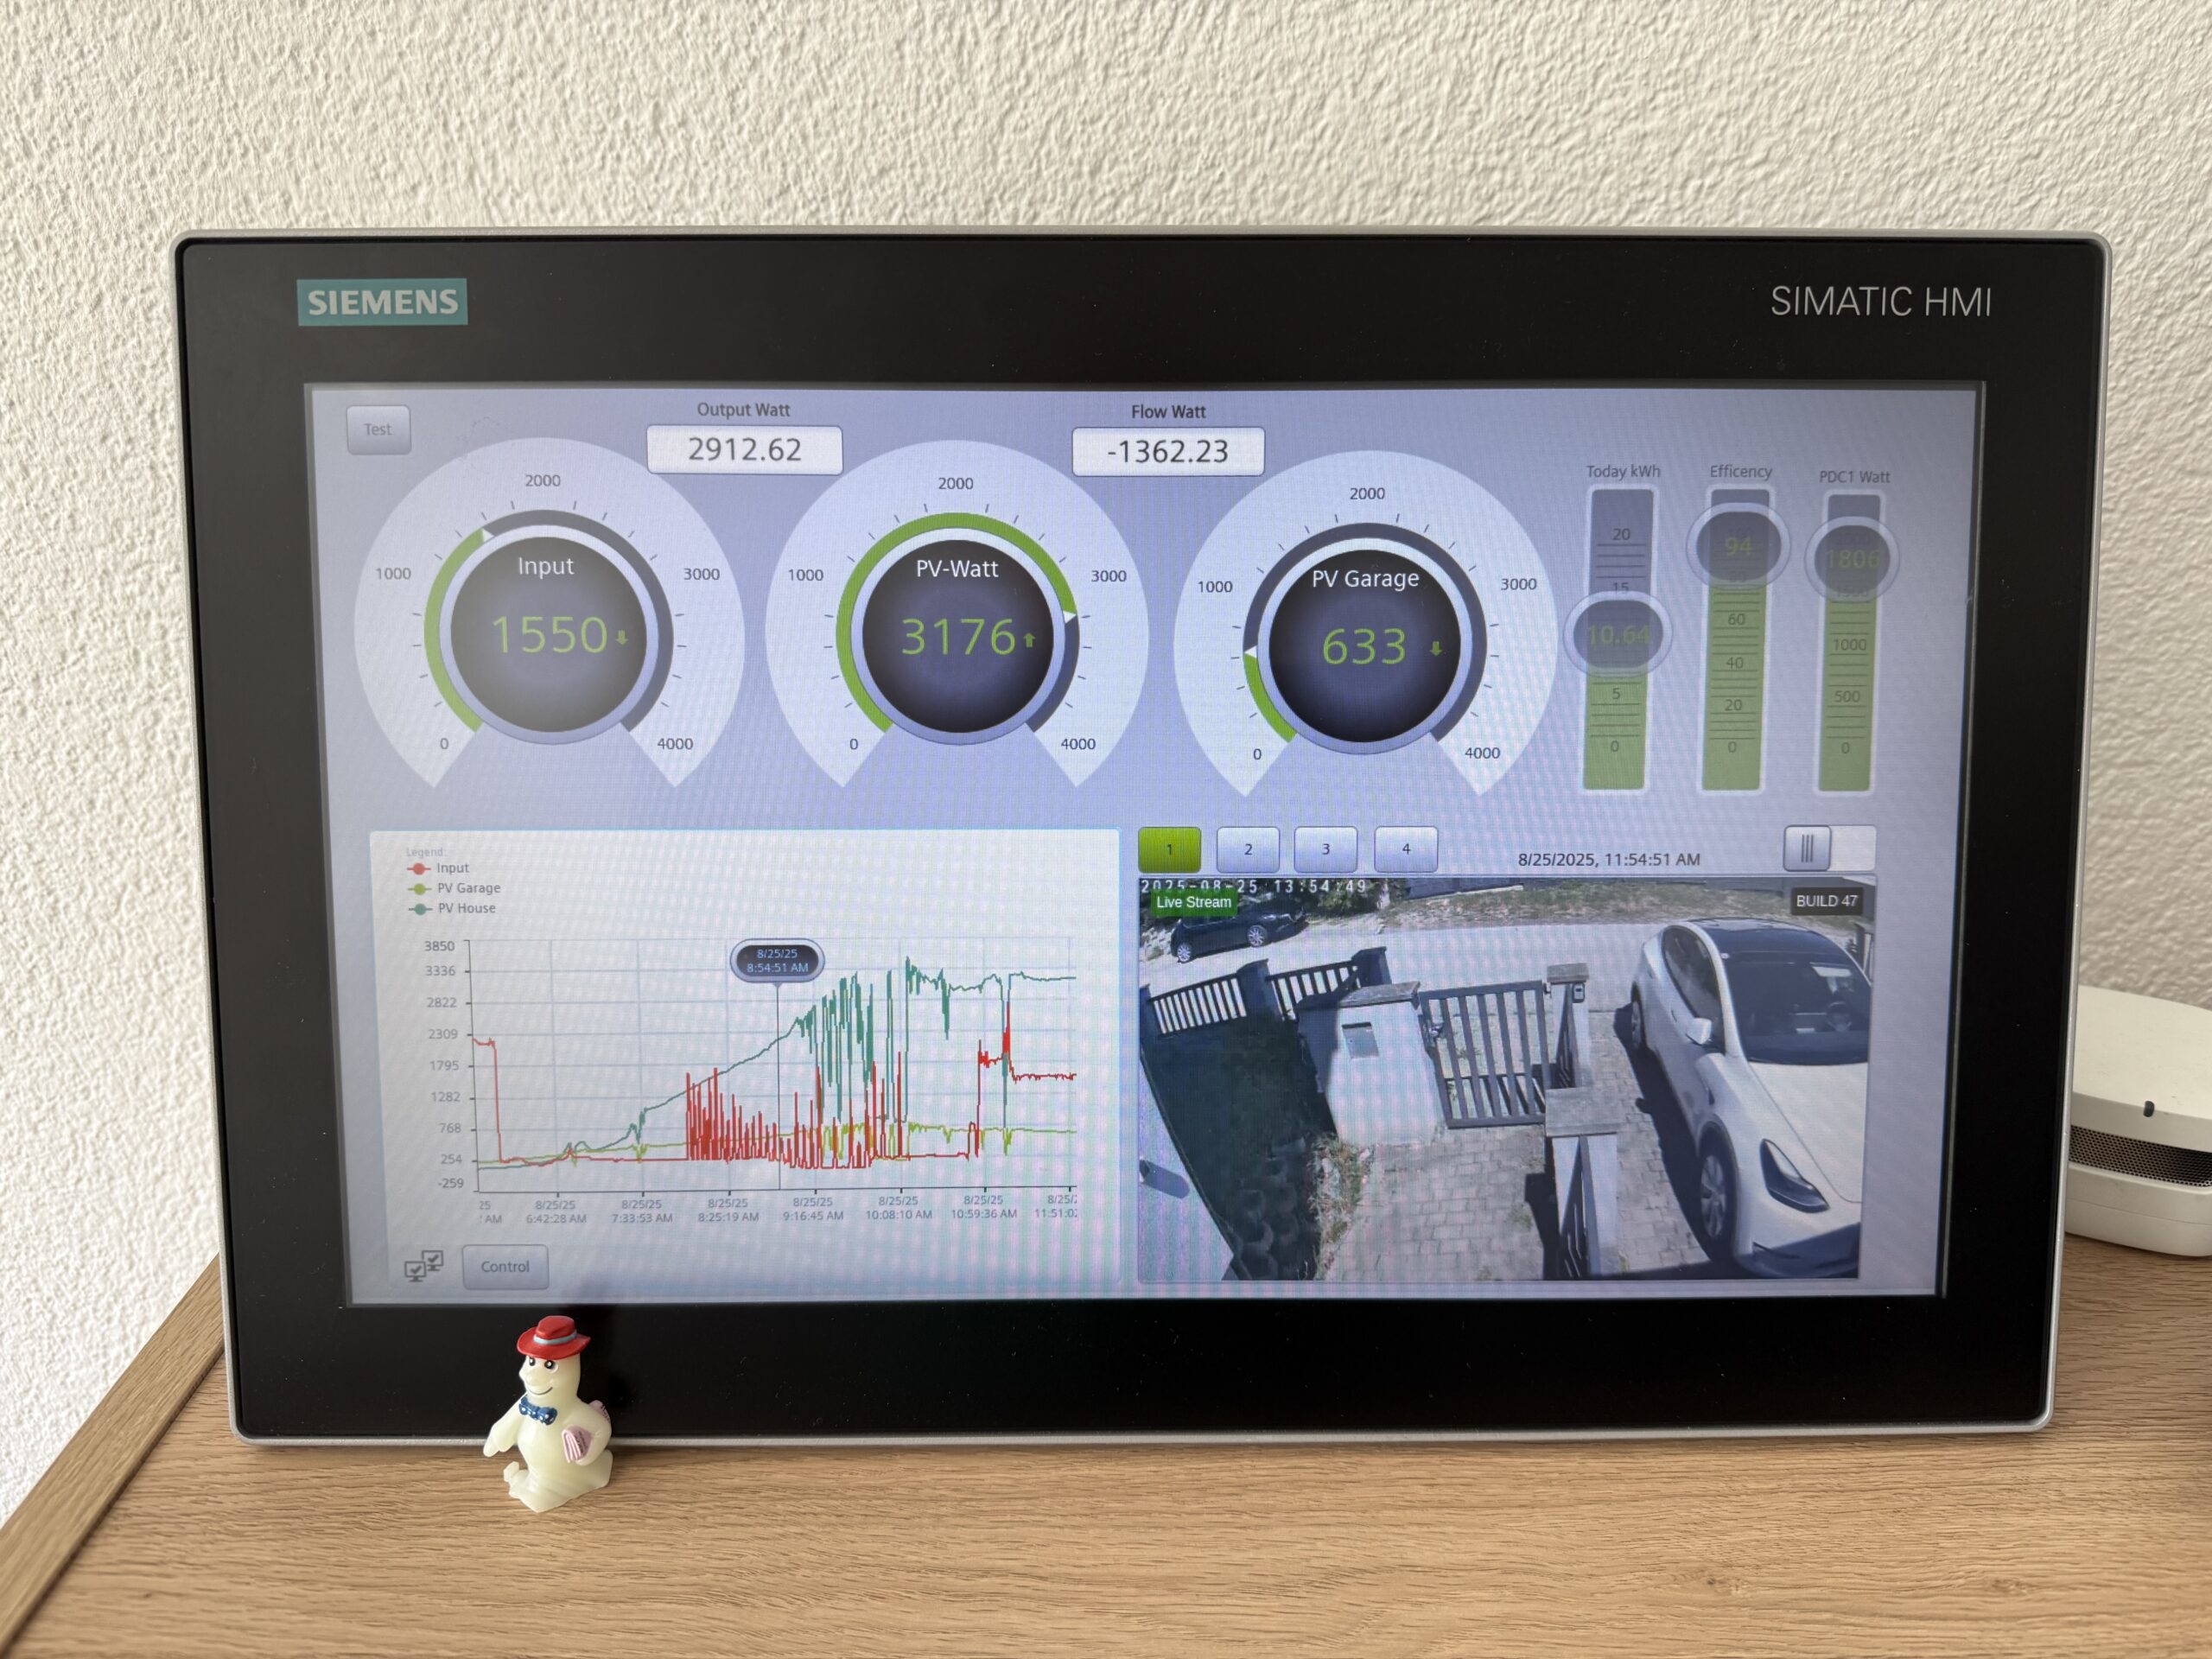
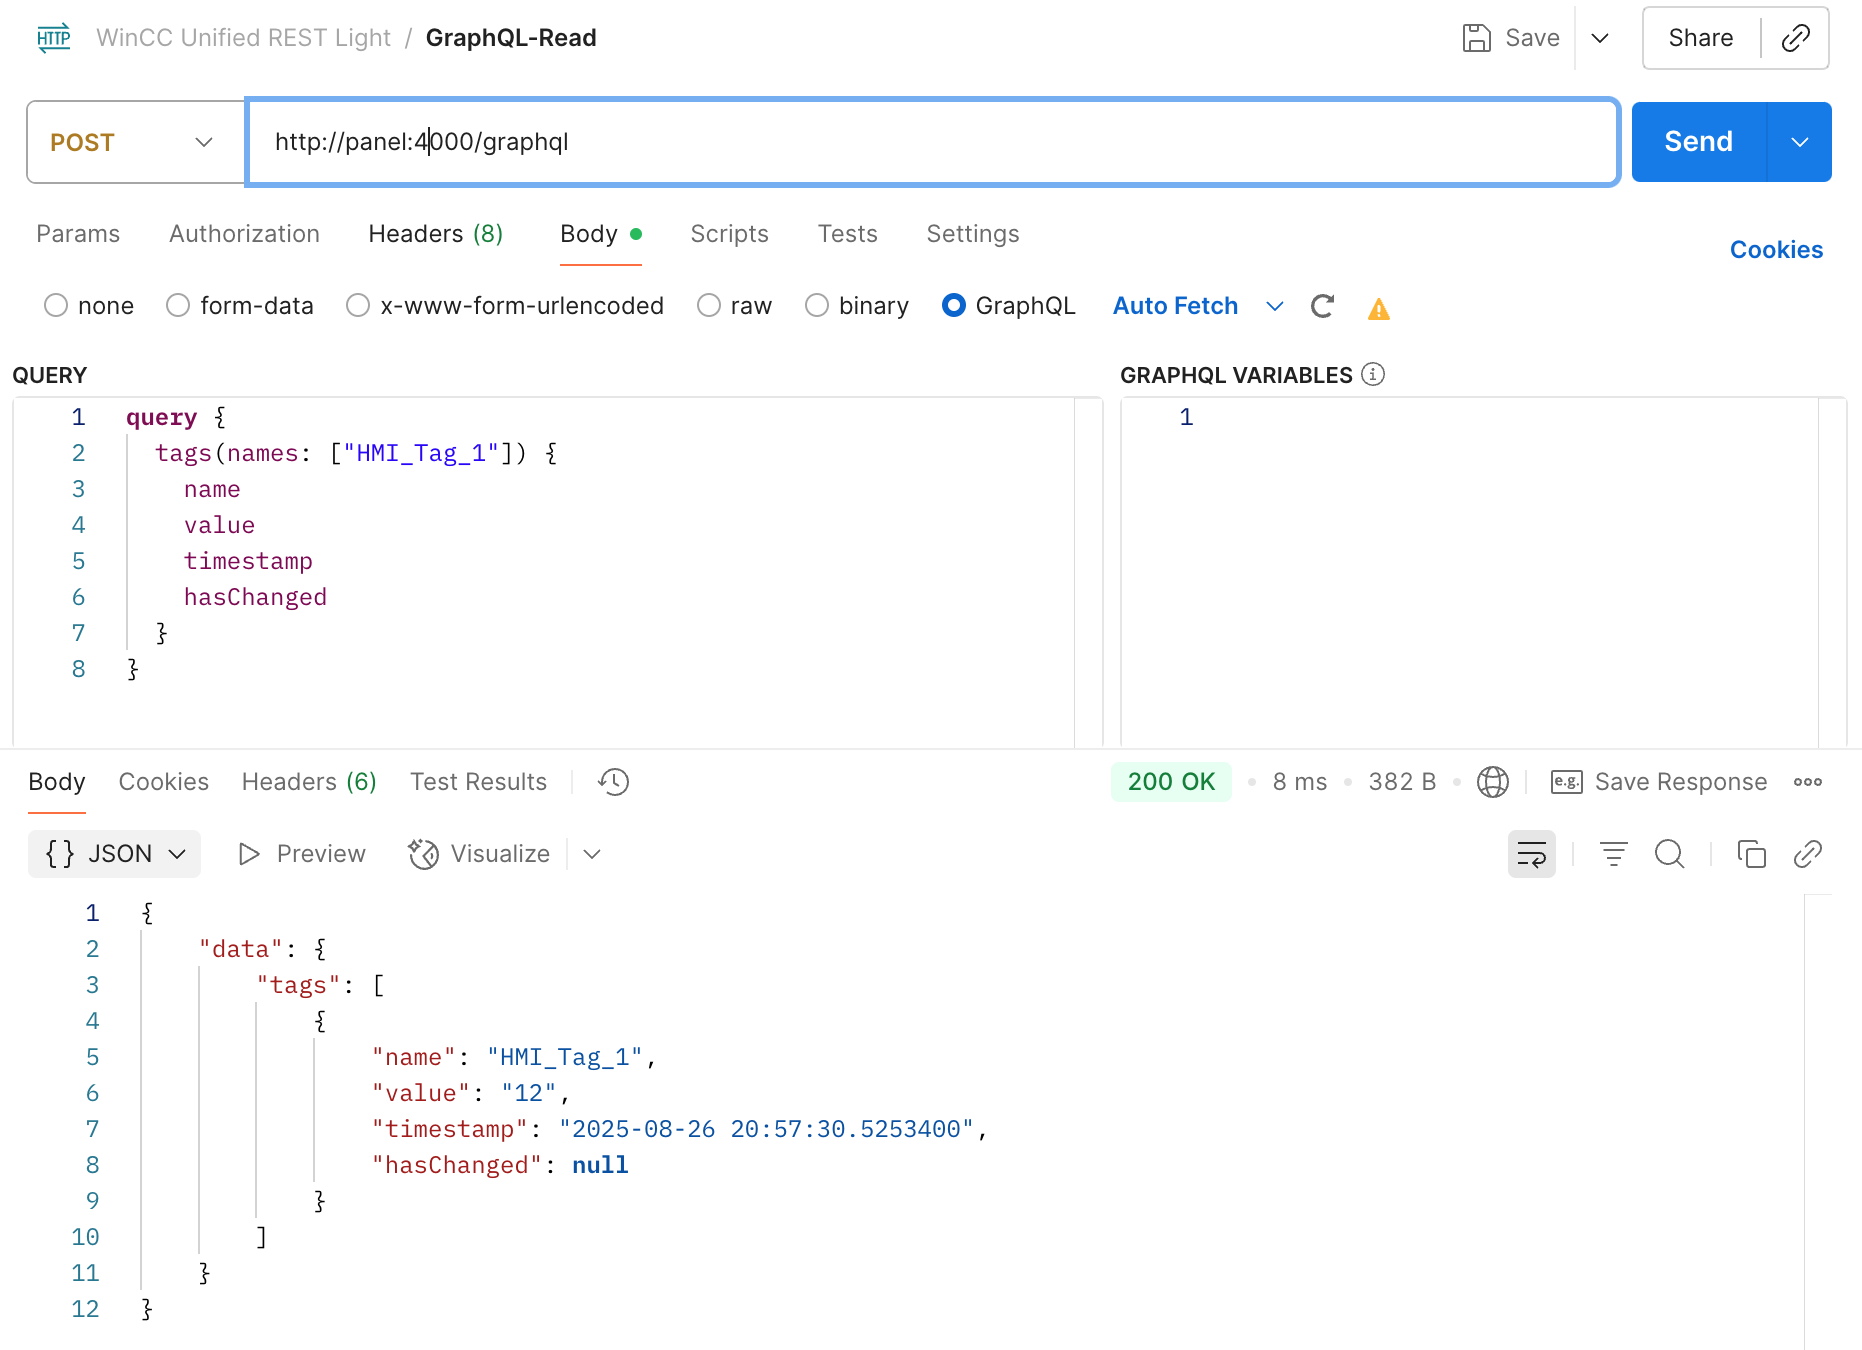
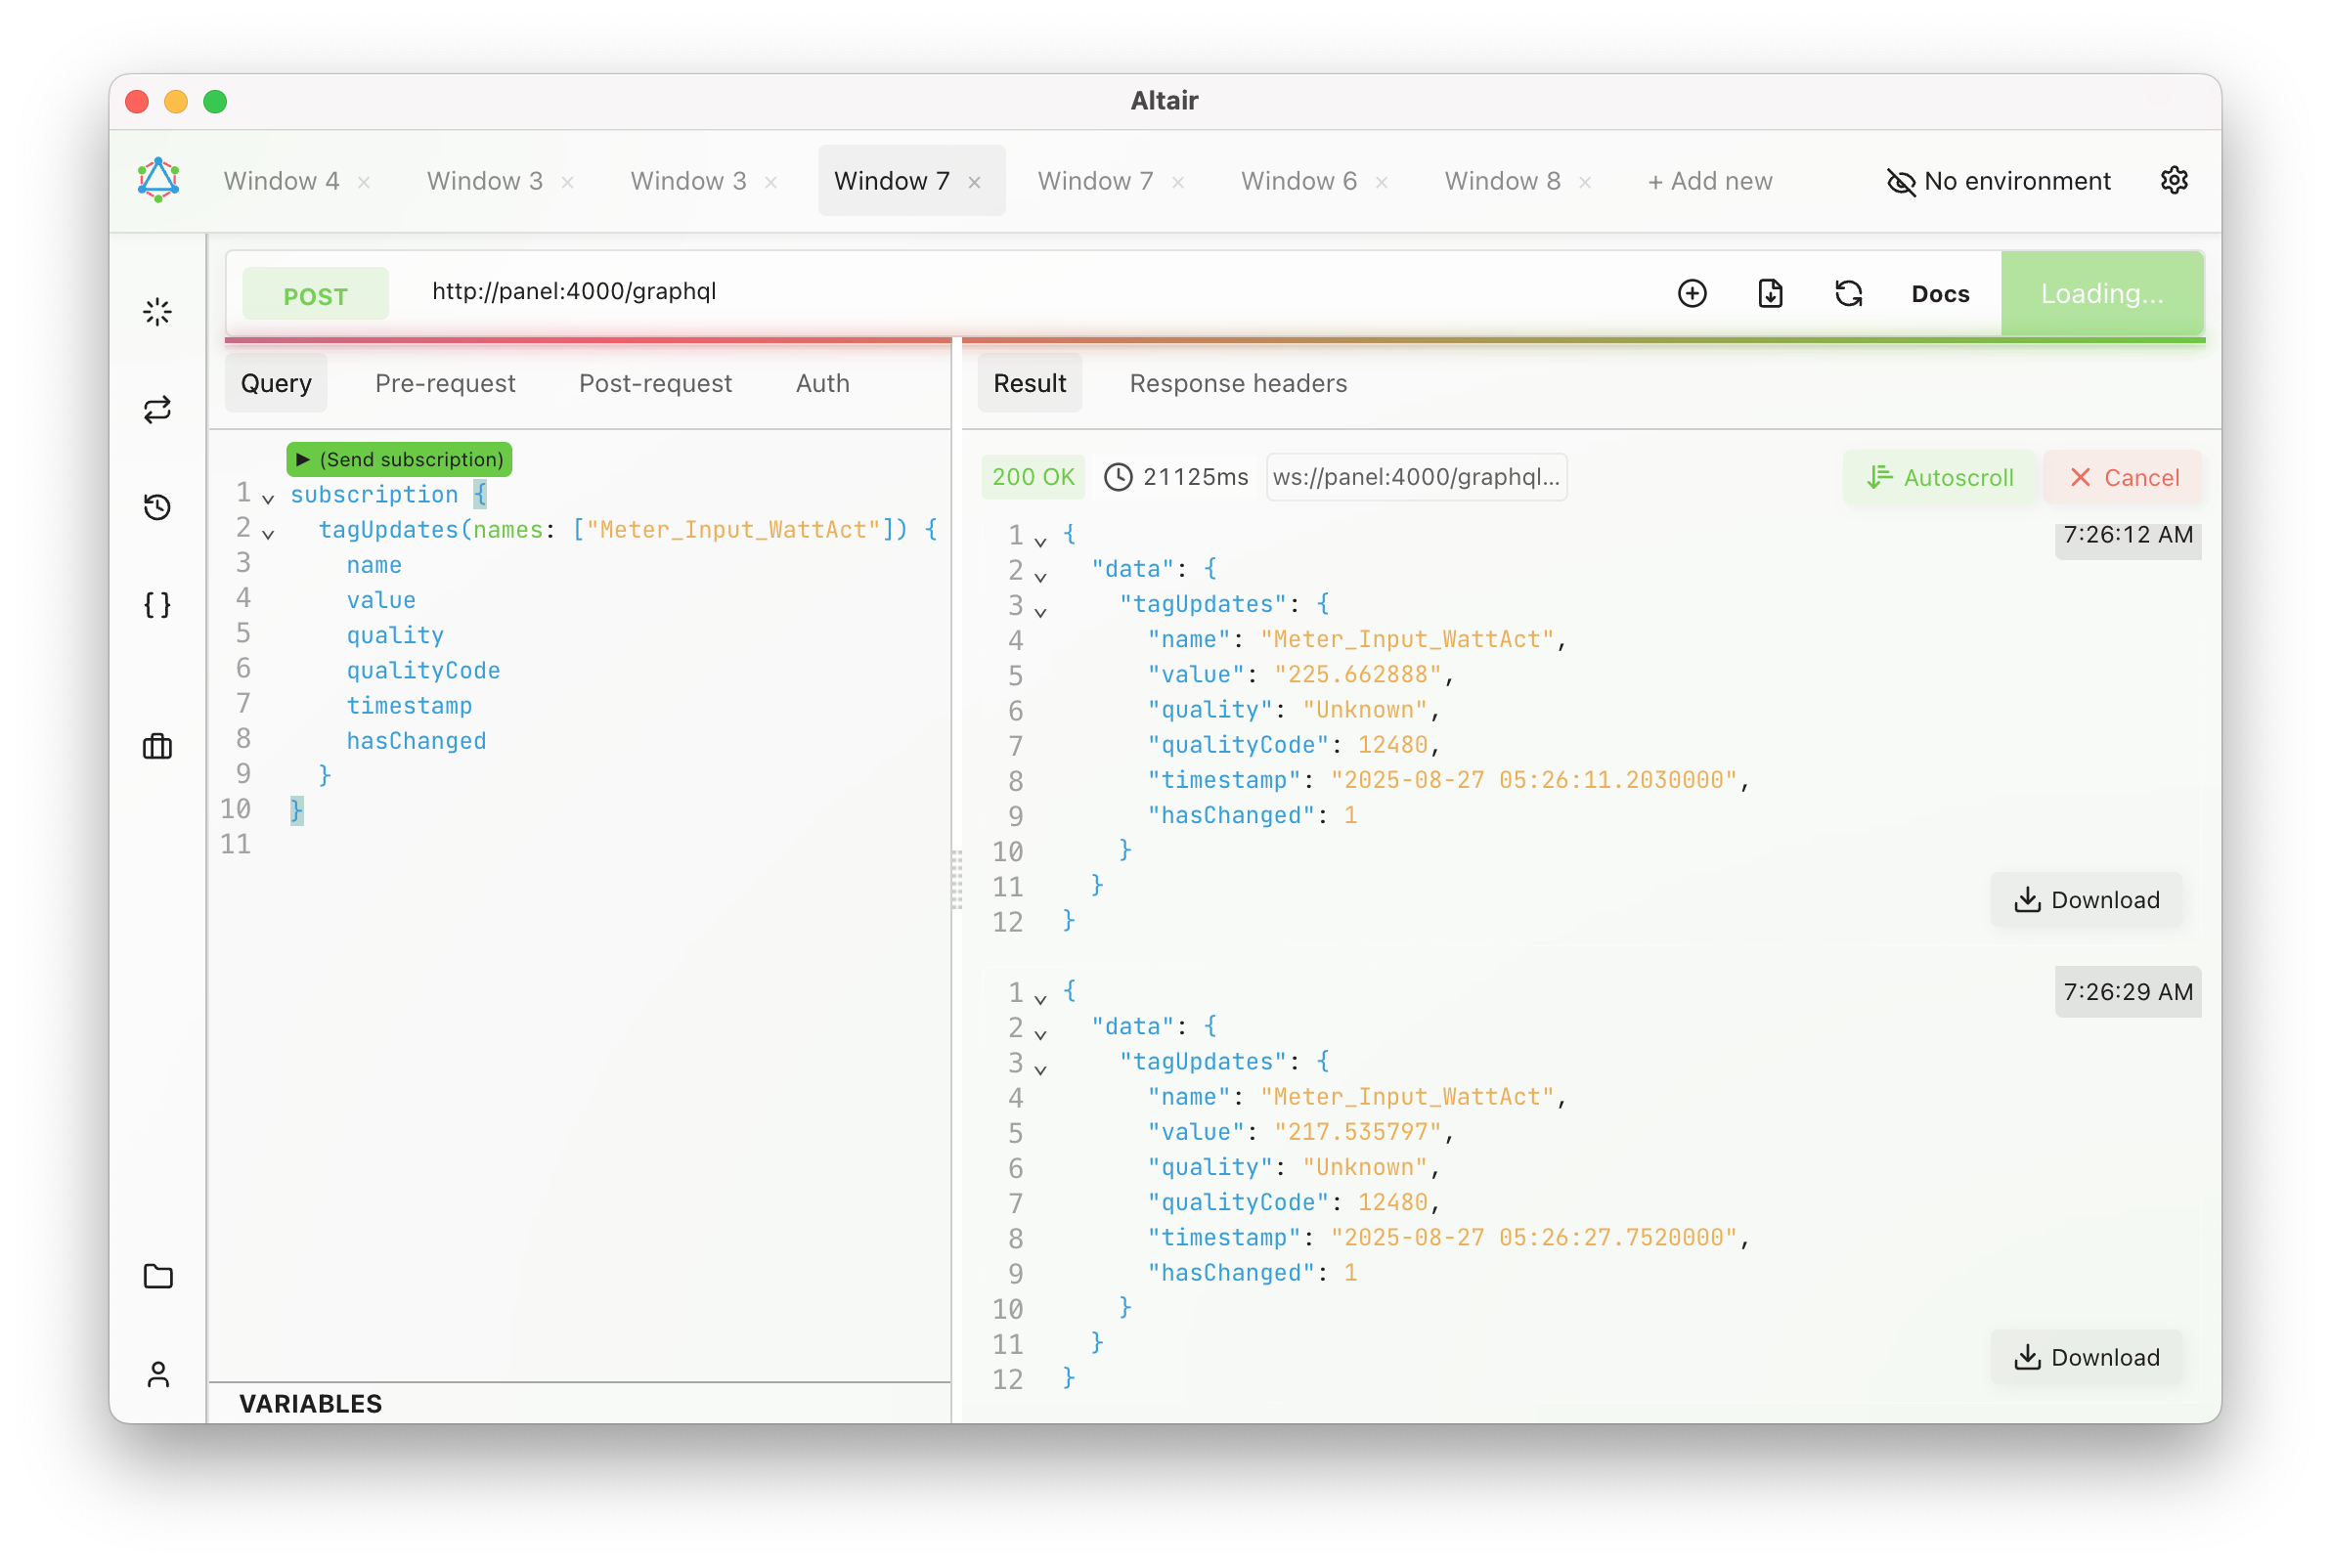
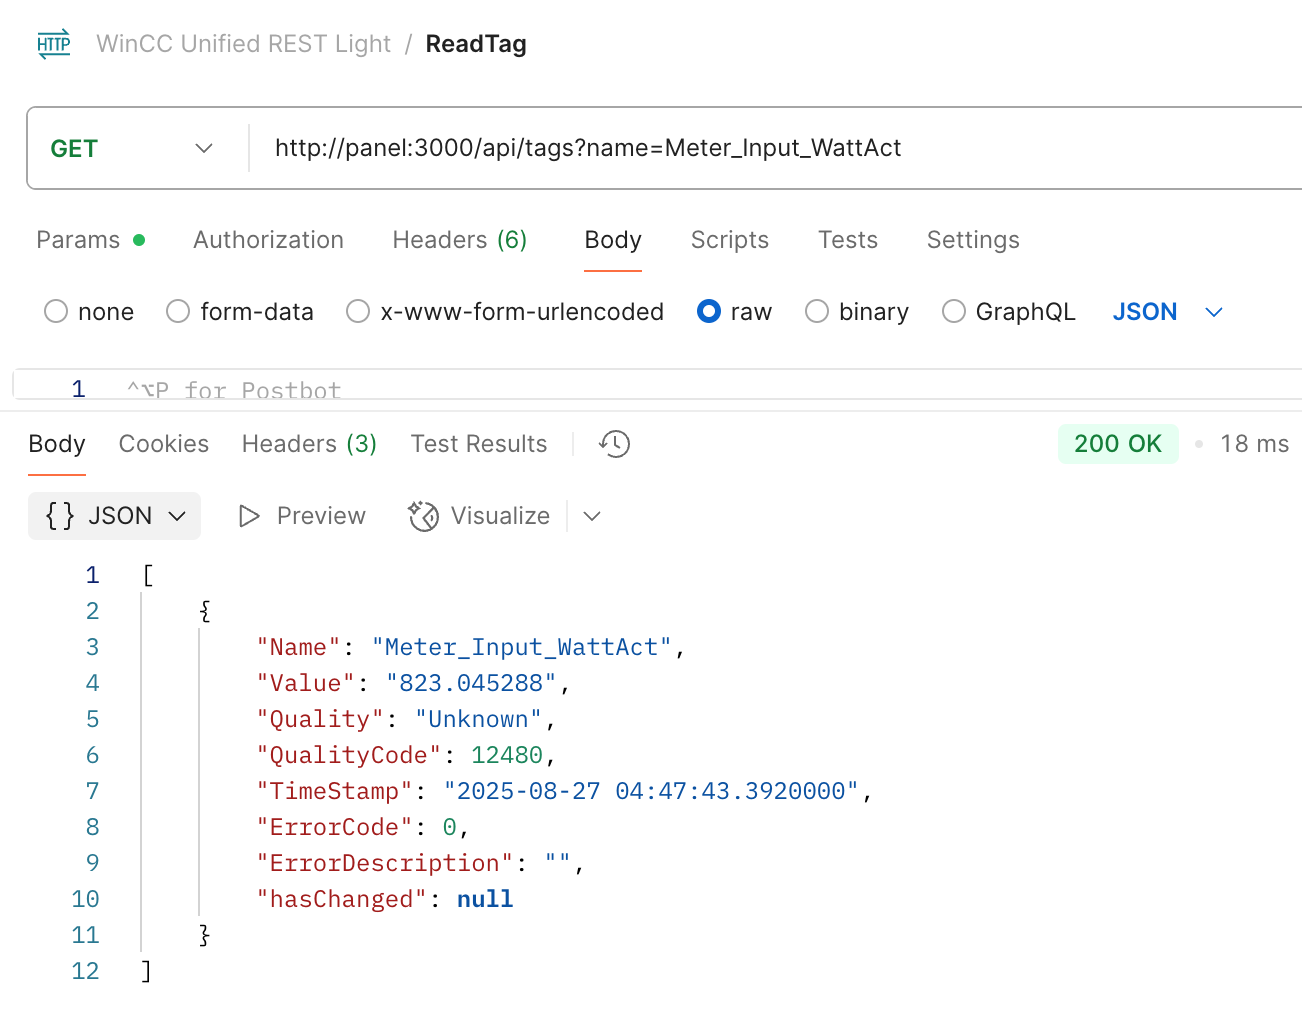
✨ Having a REST and GraphQL API on the WinCC Unified Comfort Panel — it’s possible!
I recently started using my panel at home and felt lost without having such API’s.
So I decided to change that:
✅ I built a lightweight REST and a GraphQL server for WinCC Unified.
✅ Implemented in Rust, they’re native, lightweight, single executables.
✅ Low memory and CPU footprint – thanks to Rust!
✅ With GraphQL, there is also support for tag & alarm subscriptions! 🔄
I always prefer using GraphQL — I find it tedious to constantly refer to separate REST documentation. But for some simple use cases, REST is perfectly fine.


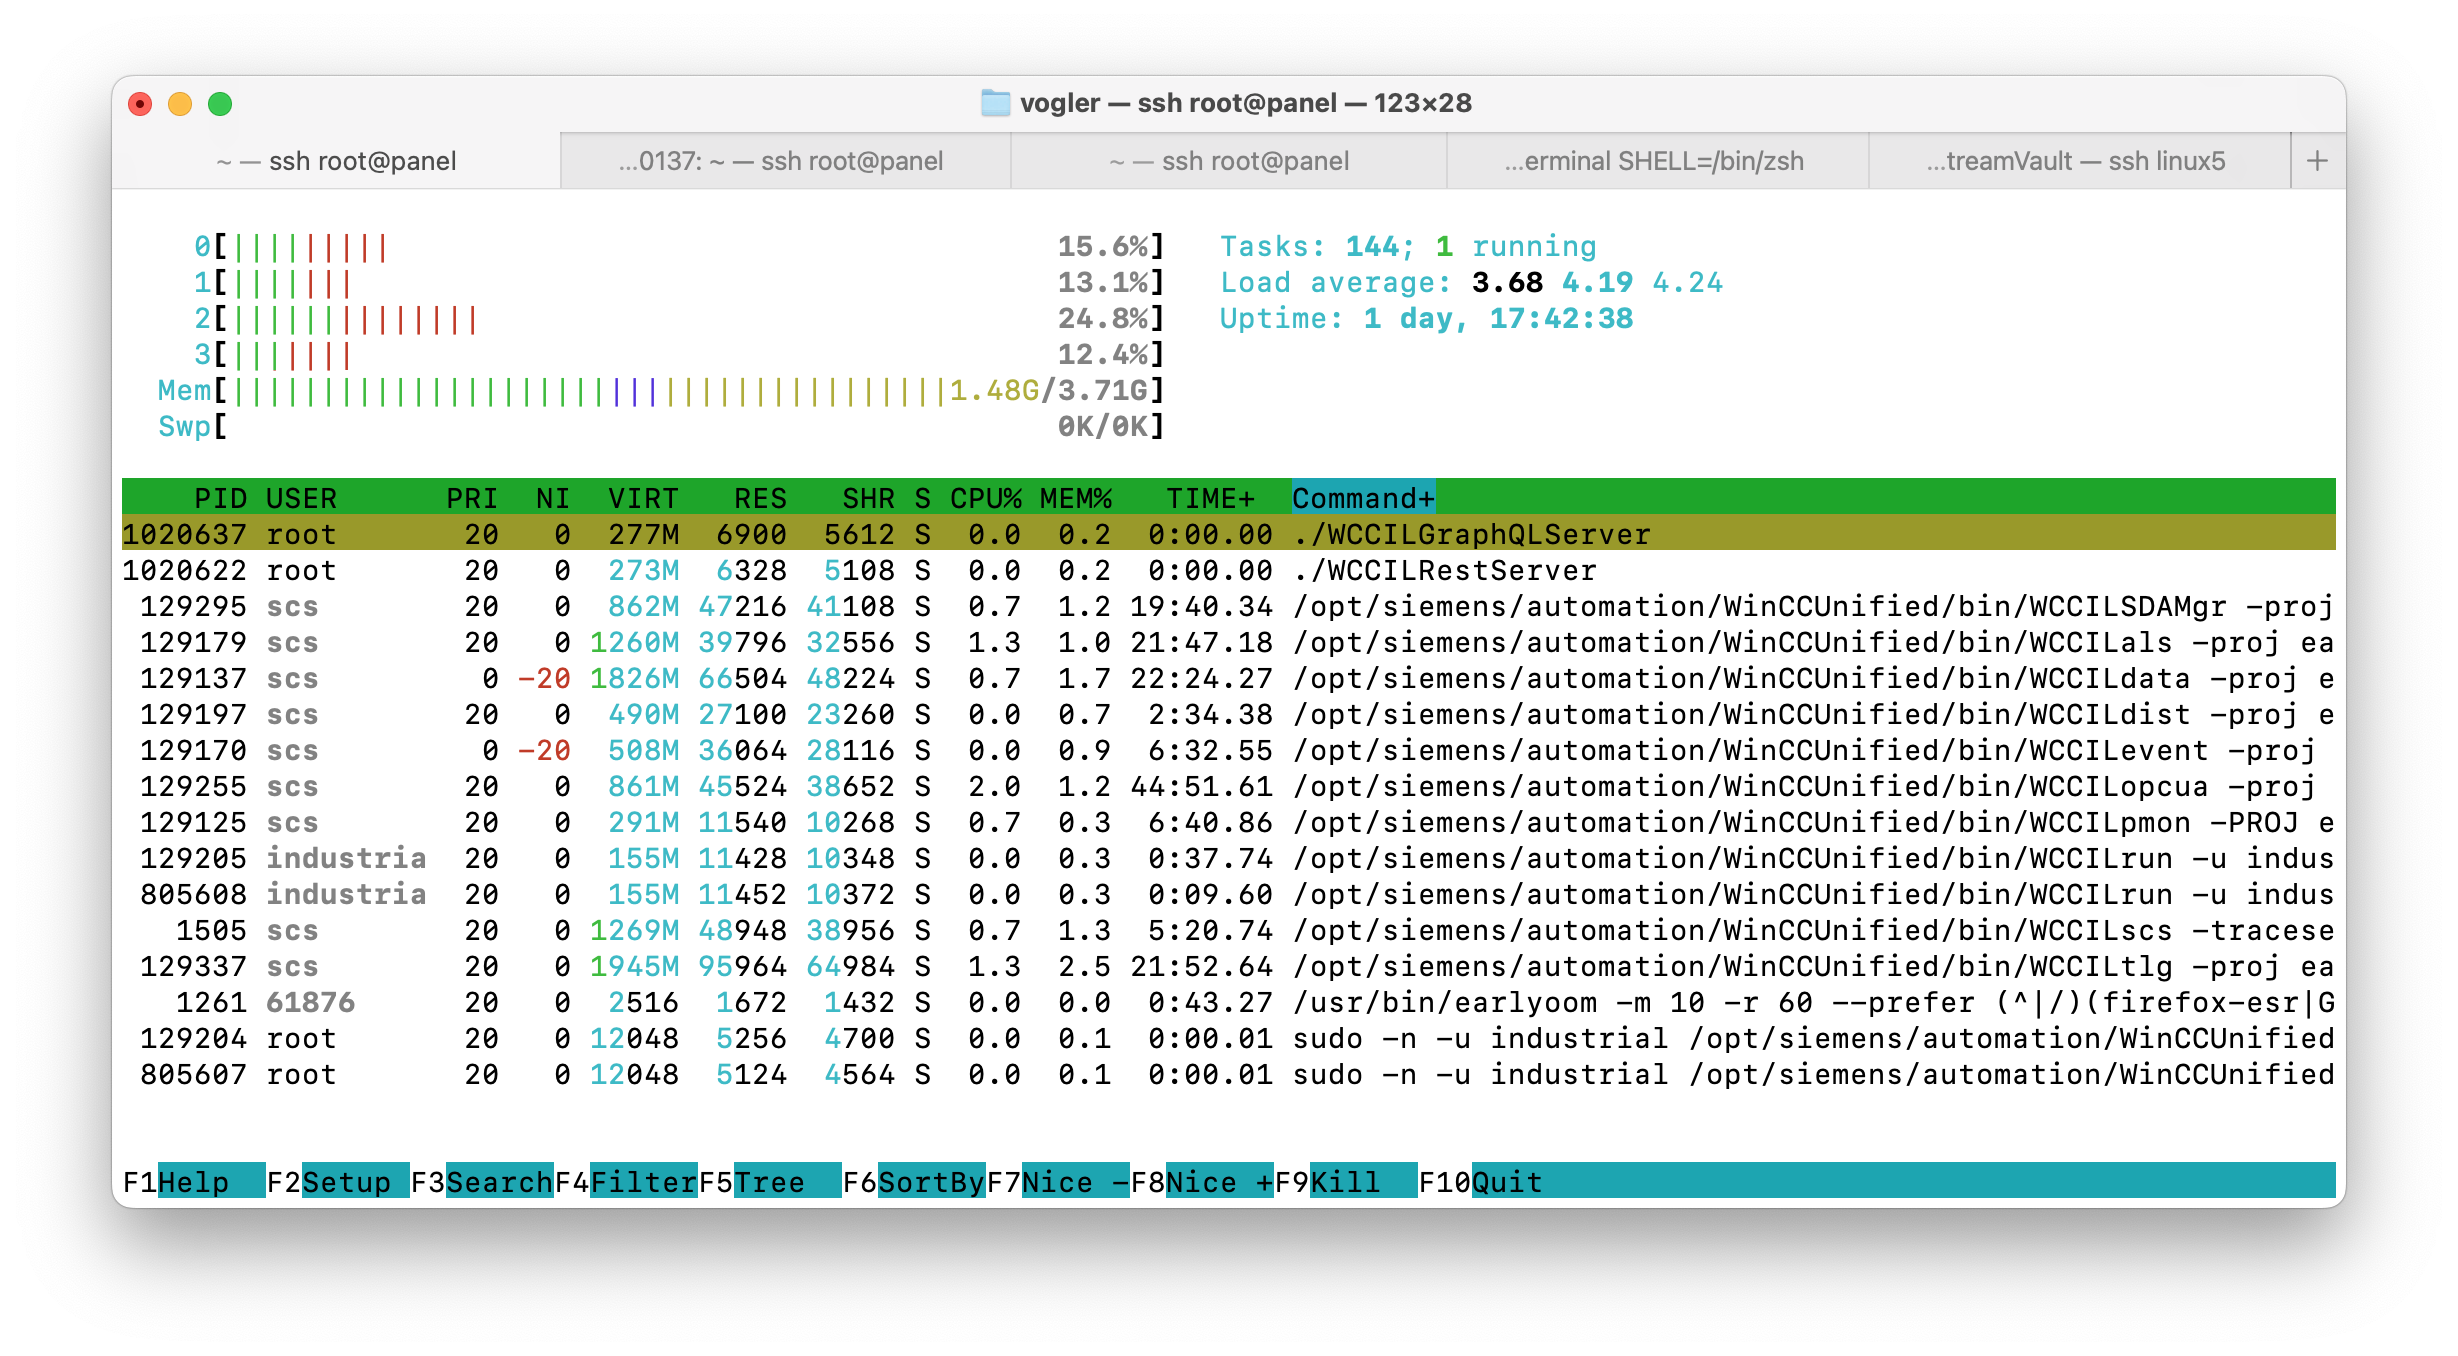
Capturing WinCC Unified Traces to Elasticsearch
In industrial automation, logging and monitoring are crucial for maintaining system health and troubleshooting issues. Siemens WinCC Unified provides built-in tracing capabilities that. In this post I will show how to capture that traces to Elasticsearch to allow seamless log collection, storage, and visualization.
Step 1: Capturing WinCC Unified Traces
WinCC Unified provides a trace tool that simplifies the process of collecting traces. The tool allows logs to be written to files, which can then be read by Logstash (a tool to process log files).
In that example we will write the log files to C:\Tools\logstash-siemens\logs directory.
"C:\Program Files\Siemens\Automation\WinCCUnified\bin\RTILtraceTool.exe" -mode logger -path C:\Tools\logstash-siemens\logs
Step 2: Collecting Logs with Logstash
Create a Logstash configuration file (e.g., C:\Tools\logstash-siemens\logstash.conf
input {
  file {
    path => "C:/Tools/logstash-siemens/logs/*.log"  # Use forward slashes for Windows paths
    start_position => "beginning"
    sincedb_path => "C:/Tools/logstash-siemens/sincedb"  # Save the reading state
    codec => plain {
      charset => "UTF-8"
    }
  }
}

filter {
  # Drop empty lines
  if [message] =~ /^\s*$/ {
    drop { }
  }

  # Add a custom field to identify the log source
  mutate {
    add_field => { "Source" => "WinCC Unified" }
  }

  # Use dissect to parse the log format correctly
  dissect {
    mapping => {
      "message" => "%{#}|%{Host}|%{System}|%{Application}|%{Subsystem}|%{Module}|%{Severity}|%{Flags}|%{Timestamp}|%{Process/Thread}|%{Message}"
    }
	  remove_field => ["message"]
  }

  # Remove leading and trailing spaces
  mutate {
    strip => ["#", "Host", "System", "Application", "Subsystem", "Module", "Severity", "Flags", "Timestamp", "Process/Thread"]
  }

  # Convert timestamp to @Timestamp (ensure it matches your log format)
  date {
    match => ["Timestamp", "yyyy.MM.dd HH:mm:ss.SSS"]
    target => "@timestamp"
    timezone => "UTC"
    locale => "en"  # Add locale to avoid parsing issues due to different formats or locales
  }
}

output {
  # stdout {
  #   codec => json_lines
  # }

  # Elasticsearch output (uncomment to enable)
  elasticsearch {
     hosts => ["http://linux0:9200"] # Change it to your Elasticsearch host
     index => "wincc-traces-%{+YYYY.MM}"
     # user => "elastic"
     # password => "elastic"
  }
}
Start Logstash to collect log files. First, download Logstash (https://www.elastic.co/downloads/logstash) and extract it to C:\Tools.
Then, run the following command to start Logstash using the specified configuration file:
C:\Tools\logstash-8.17.3\bin\logstash.bat -f C:\Tools\logstash-siemens\logstash.conf
Forwarding Traces from WinCC Unified Panels
For WinCC Unified Panels, trace forwarding can be enabled, allowing traces to be captured with the WinCC Unified trace tool on a PC. The traces will then be also be written to files on the same PC (by the tool you started at Step 1).
“C:\Program Files\Siemens\Automation\WinCCUnified\bin\RTILtraceTool.exe” -mode receiver -host
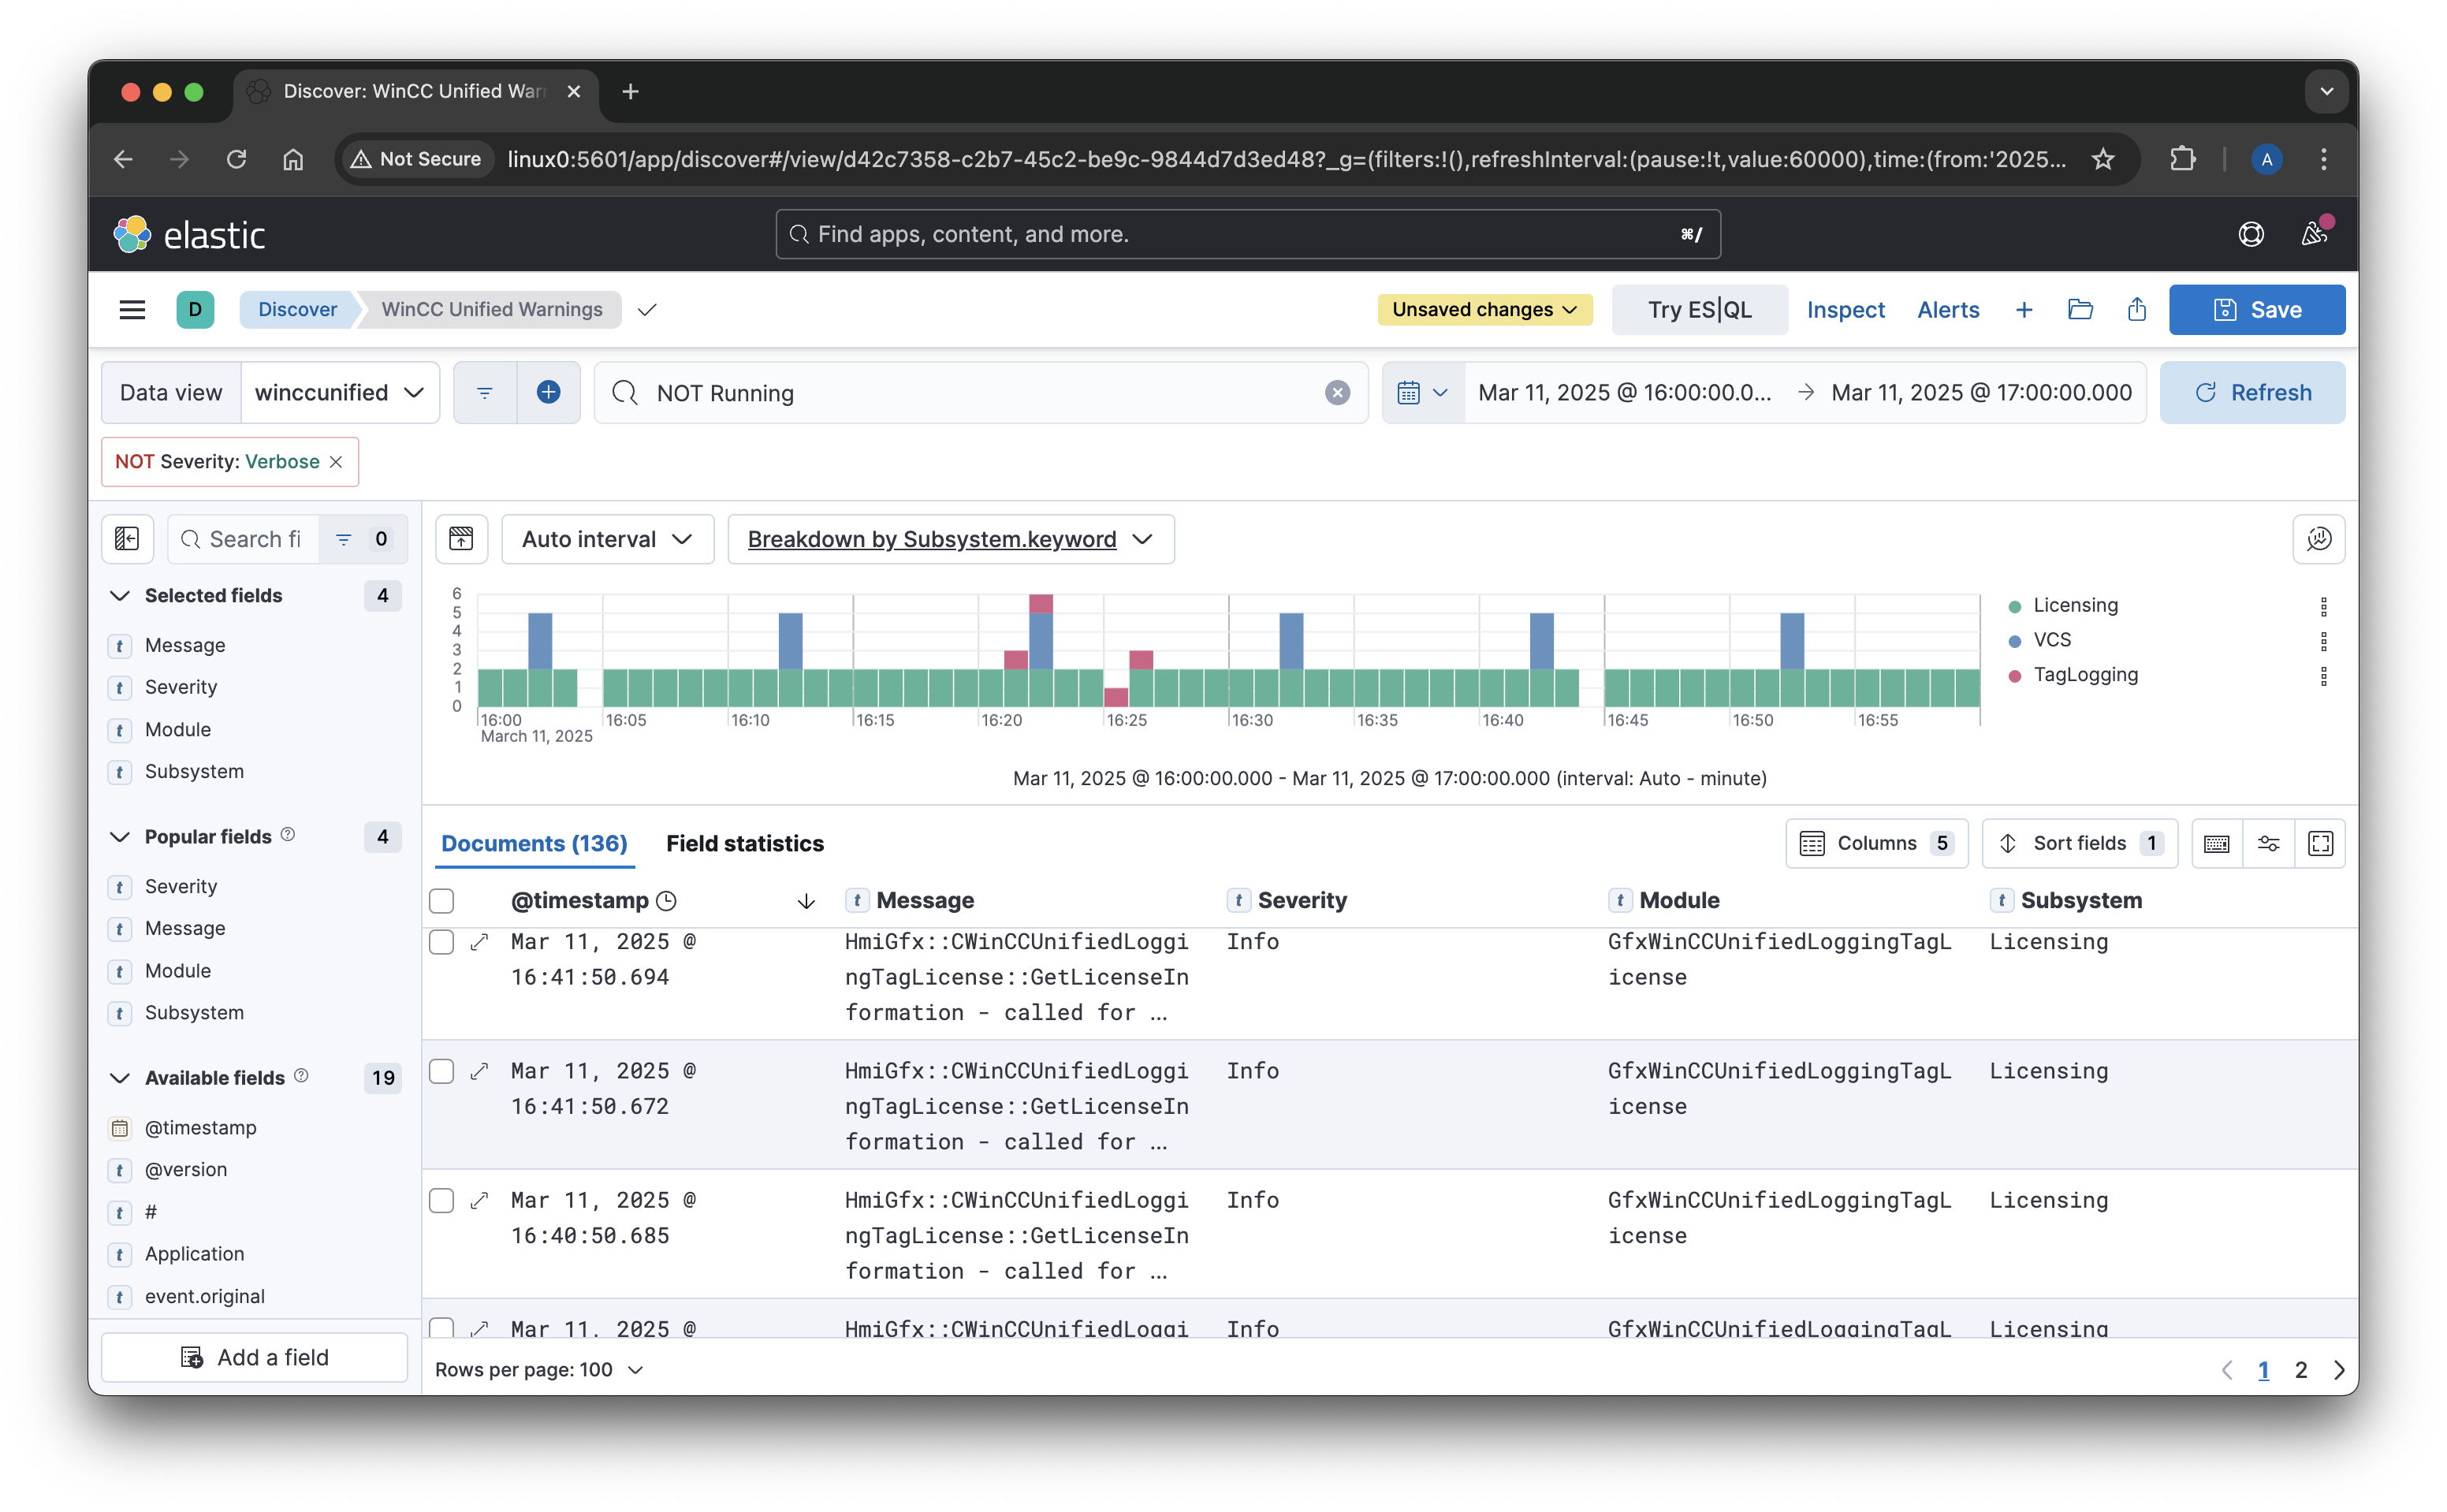
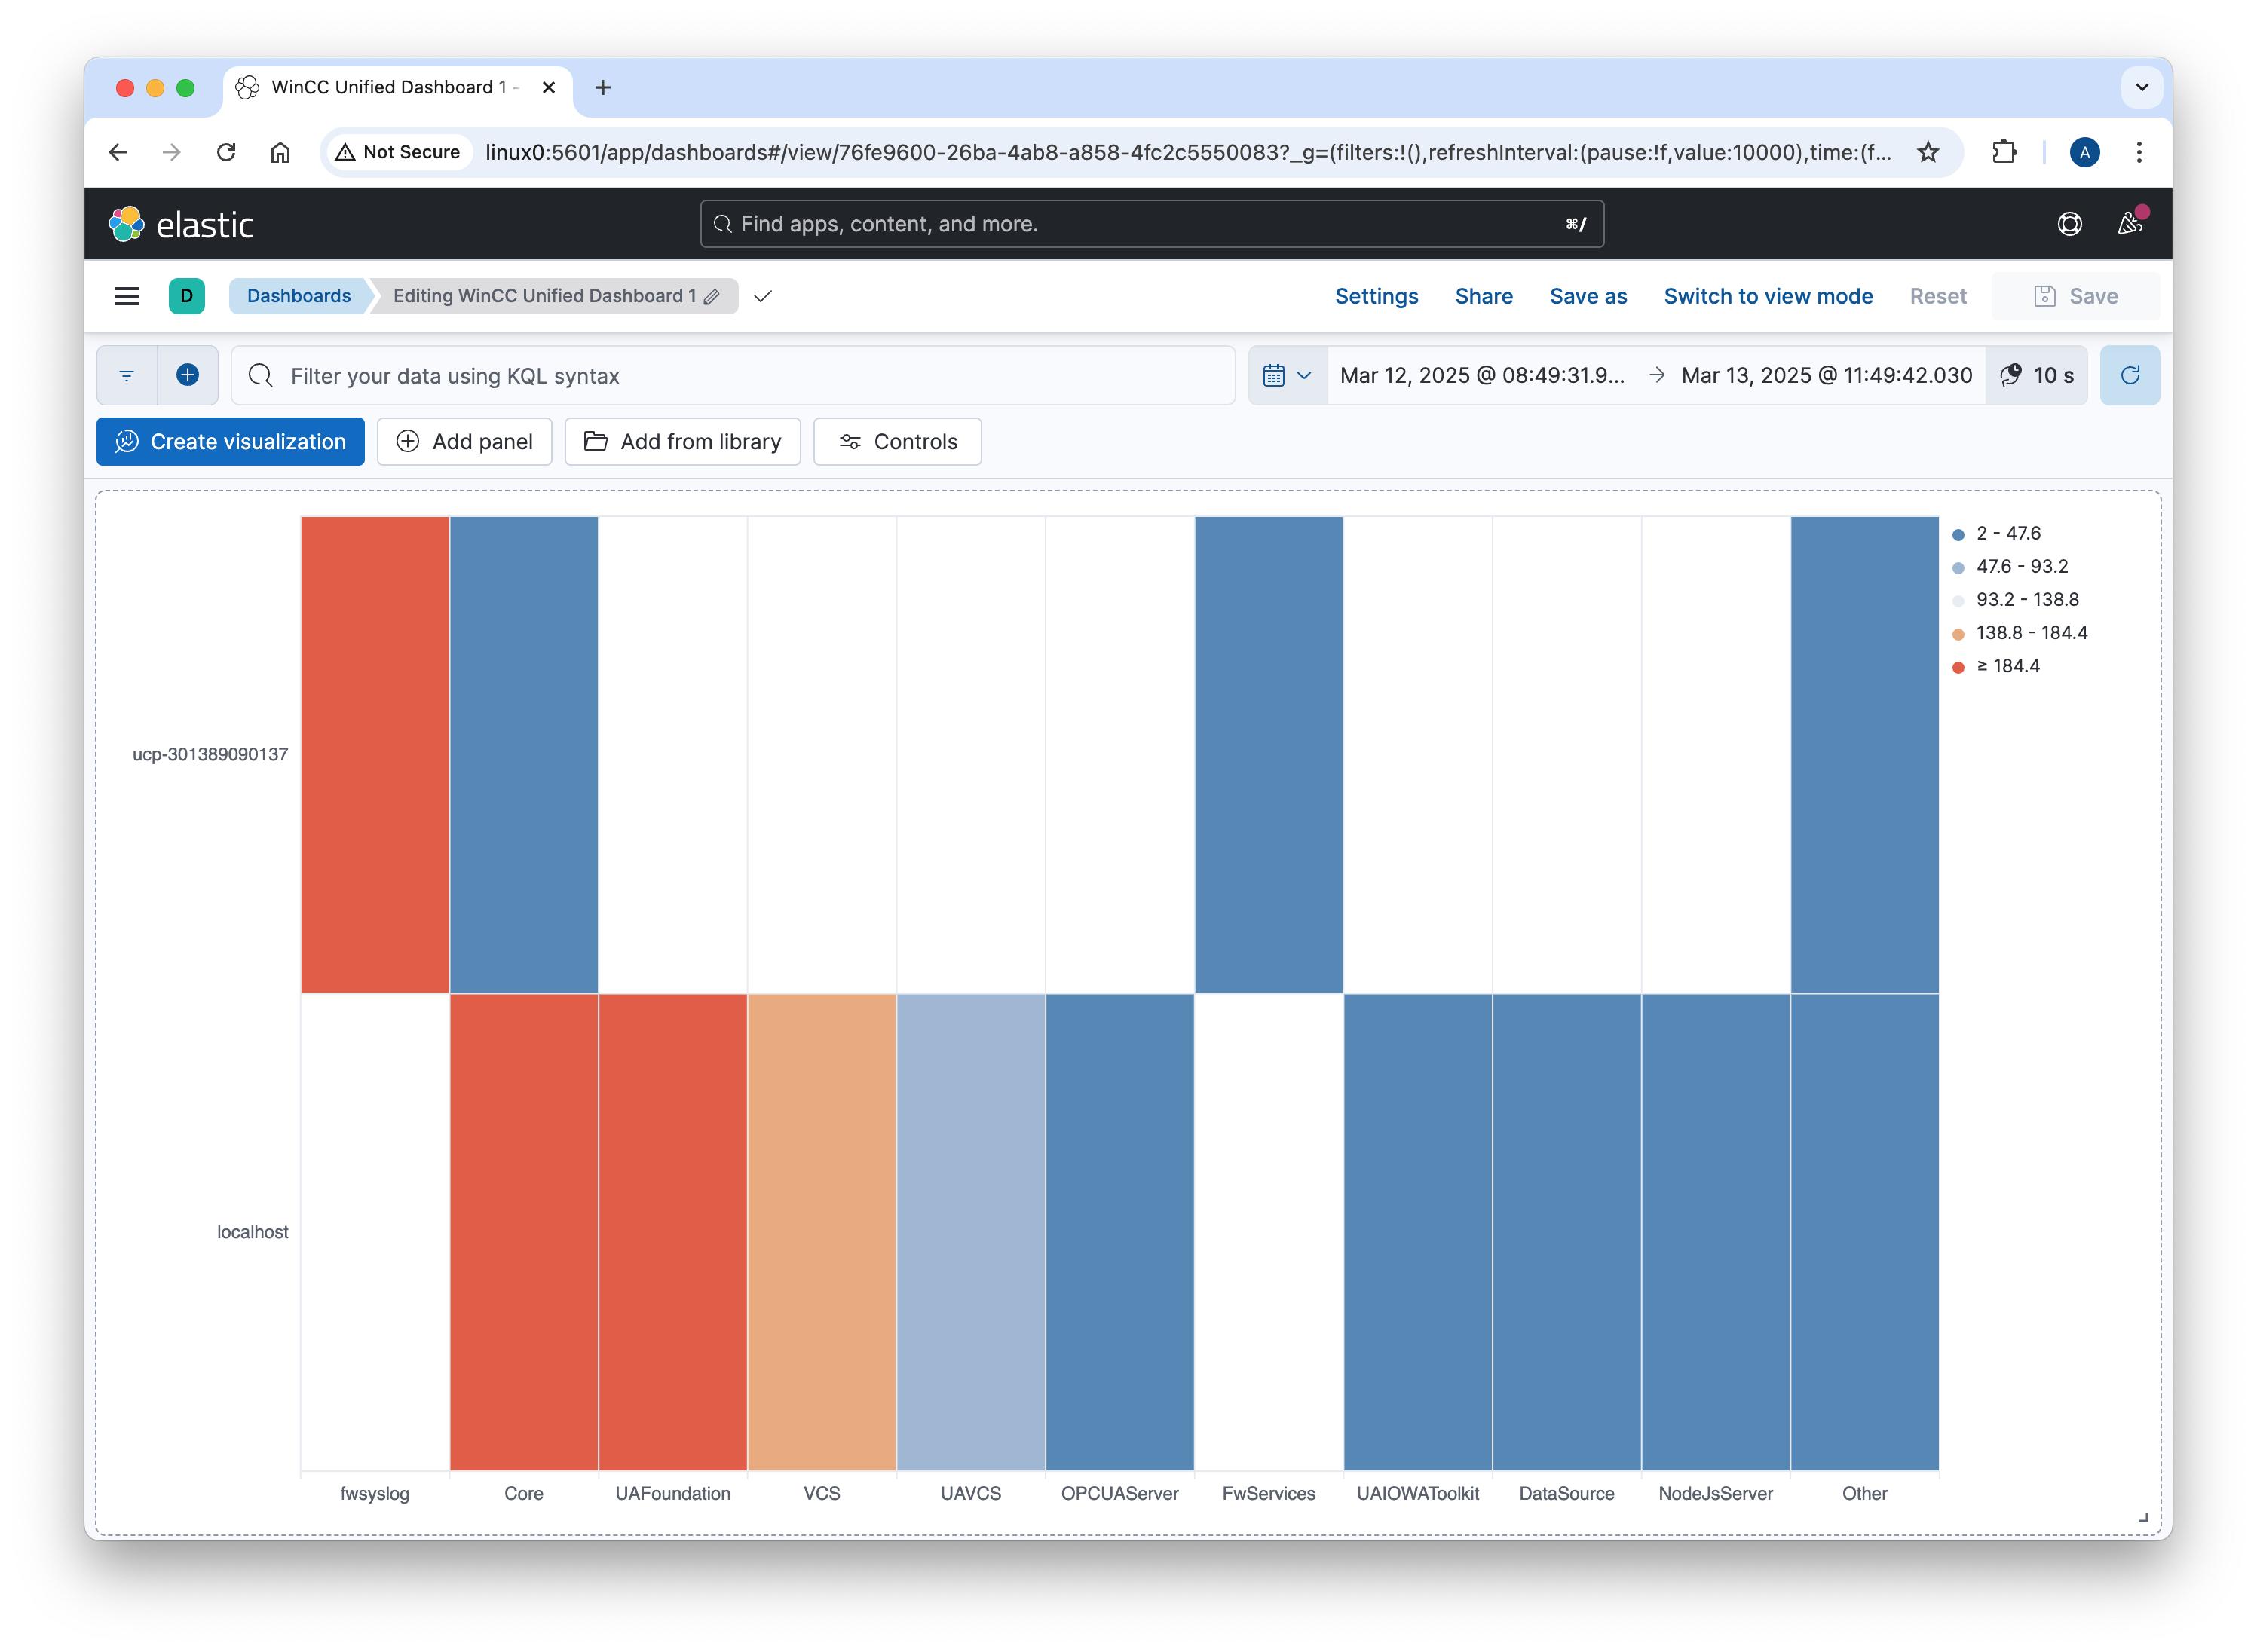
Step 4: Visualizing Logs in Kibana
Once logs are stored in Elasticsearch, Kibana provides a powerful interface to explore and analyze them.
- Open Kibana and navigate to Stack Management > Index Patterns.
- Create a new index pattern matching
wincc-traces-*. - Use Discover to explore logs and apply filters.
- Create dashboards and visualizations to monitor system health and performance.
MQTT Bandwidth Efficiency: The Role of Topic Alias in MQTT 5 and Why I Only Got It Working with EMQX?
Recently, I conducted a test to analyze the bandwidth usage of MQTT, and one feature stood out as particularly impactful: the Topic Alias feature in MQTT 5. This feature can significantly reduce the overhead associated with long topic names, which is especially relevant in UNS (Unified Namespace) implementations using ISA-95-style topics, where topic names tend to be lengthy and sometimes consume more bytes than the payload itself.
💵 It can make an impact if you are being charged based on the amount of data transferred (cloud).
🚨 The Importance of Topic Alias
The Topic Alias feature allows a client to map a topic name to a shorter alias, reducing the amount of data transmitted. This can drastically lower bandwidth usage when transmitting messages with long topic names.
Using Topic Alias during publishing is straightforward but requires the topic-to-alias mapping logic to be implemented in the client program (which is not difficult to do).
On the subscriber side, the implementation should ideally be seamless. In theory, a subscriber needs only to set the maximum allowed alias number during the connection phase. This should make the feature easy to adopt for receiving applications.
👉 During my tests, I discovered something surprising: EMQX was the only broker (of the ones I have tested) to support Topic Alias for subscriptions(!) out of the box. With others I was unable to enable this functionality.
👉 To note: most articles about Topic Alias focus primarily on its use during publishing, not on subscriptions. I was focused on subscriptions.
Bachelors Thesis from 2014: Optimizing the use of photovoltaic systems in single-family homes
Abstract
Within this thesis we implement a prototype of a smart home process control system for increasing the consumption of self-produced photovoltaic energy. To increase the consumption of self-produced energy, the energy is stored in a thermal storage by charging it automatically in case there is excess energy.
Due to the increasing popularity of small energy-producing plants (mainly photovoltaic systems) the allowances for energy fed into the public electricity grid decreases. The income from this kind of electricity is lower than the price of purchased electricity. By increasing the self-consumption of energy, the profitability of a photovoltaic system can be significantly improved.
Based on the findings of the thesis 1 „Eigenverbrauchsoptimierung vonPhotovoltaikstrom in Einfamilienhäusern“ (Vogler, 2014), the components to build such an integrated control system are implemented. The goal is to build an automated control system, that enforces power consumption when there is enough self-produced electricity available.
Due to long product cycles, companies in the process control-business are comparatively innovation averse and expensive. But with systems such as Arduino or Raspberry Pi, which allow an easy entry to the embedded programming and control technology, an intelligent control system for self-consumption of photovoltaic electricity by thermal storage can be implemented with low cost.
Our system consists of loosely coupled separated components. By the use of service interfaces, the components are highly distributed, which follows the current IT trend of ” IoT – Internet of Things “.