MonsterMQ can run AI Agents – triggered by MQTT topics or on a schedule, with direct access to broker data in the context, and support for MCP Servers (including the internal one).
The agent can publish data to other topics – and that can trigger the next little agent. 🔄
Is this a good idea? Honestly, I don’t know yet – this is purely for learning right now.
All posts by vogler
🧌 What has MonsterMQ become?
I started this as an open-source MQTT broker, to learn MQTT. But somewhere along the way it grew into something bigger…
Connectivity:
🔄 MQTT Bridging
📨 Kafka Bridging
🔌 OPC UA Client & Server
⚙️ PLC4X (PLC connectivity)
🏭 WinCC OA & WinCC Unified Clients
🚀 NATS Client & NATS Protocol Server
Processing & Transformation:
🕸️ Neo4J integration
⚡ SparkplugB Decoder
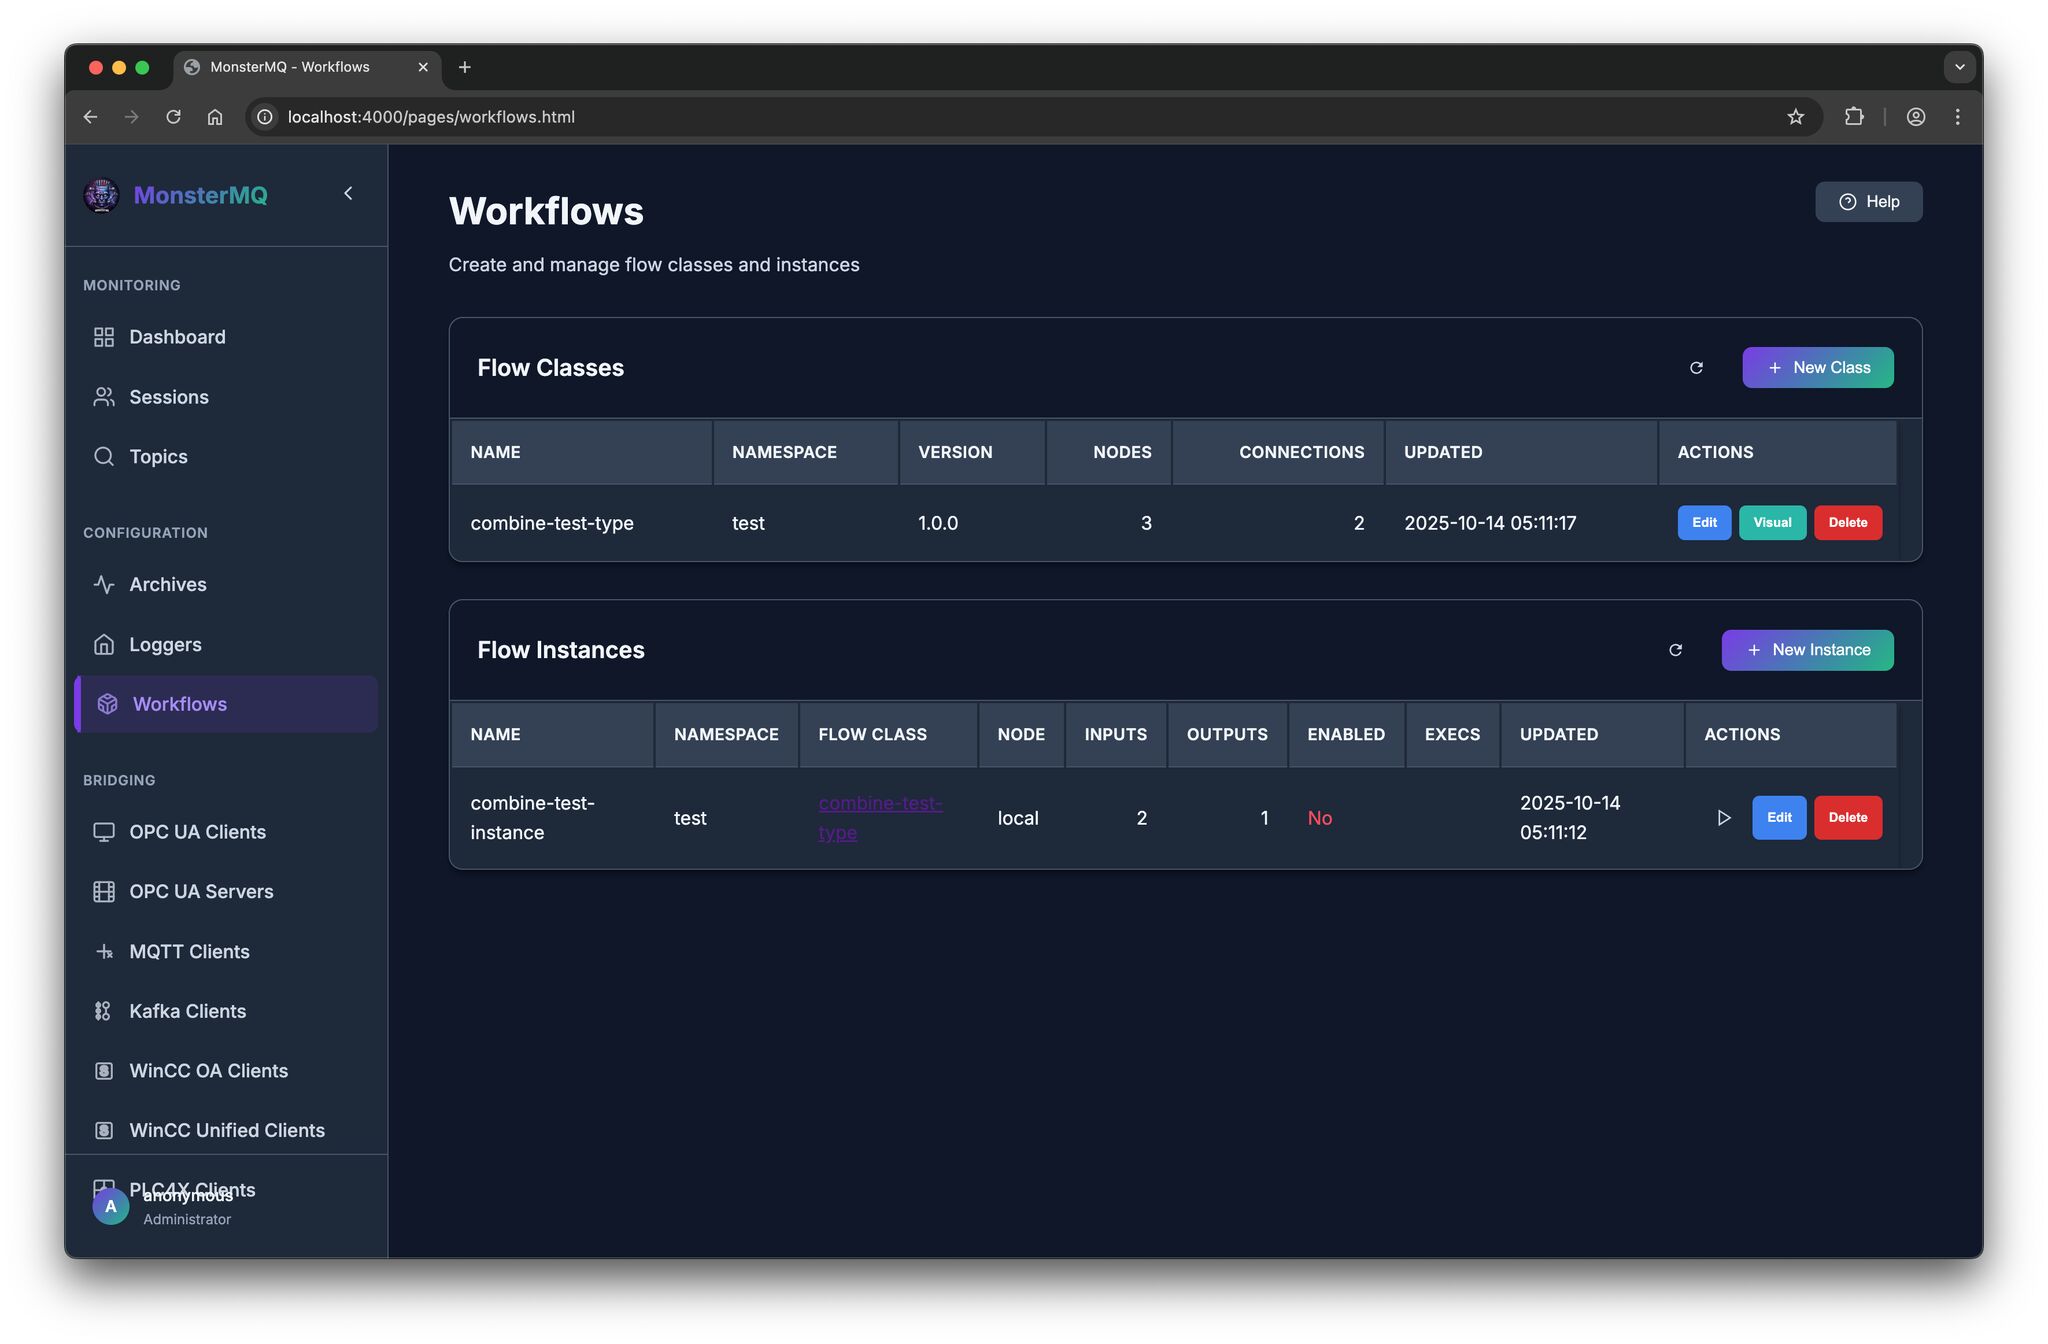
🔄 Workflows for data transformation
🕸️ Clustered and distributed setup
Archiving & Storage:
💾 Last value storage: in-memory and databases, infinite retained messages
🗄️ Internal database archiving: MongoDB, Postgres, Timescale, SQLite
❄️ Logging to QuestDB, MySQL, Postgres, Timescale, Snowflake
APIs & Interfaces:
🔍 GraphQL
📡 MQTT API
🤖 MCP Server
📊 Prometheus
🏭 i3x / CESMII
🔜 REST API — coming soon!
An integrated topic browser, visualizer, and AI analyzer. 💡
👉 MonsterMQ.com
MonsterMQ got a NATS Bridge!
The broker now has a NATS bridge integrated – you can receive messages from NATS and also publish to NATS.
For example, with simple wildcard subscriptions you can bring your topics straight into NATS – no extra glue code needed!
A big thanks to Kevin Joosten for this contribution!
‼️ And I added that MMQ can act as a NATS Server (NATS core 1.0). So, now NATS clients can connect to MonsterMQ and pub/sub to topics. NATS protocol is super simple.
This opens up some new integration scenarios where MQTT and NATS need to coexist in the same architecture.
Star it if you like it – and drop me a message if you’re using MonsterMQ in your setup!
MQTT Broker with i3x? – MonsterMQ got it!
A i3x server integrated directly into MonsterMQ!
What’s happening under the hood:
👉 MQTT topics are stored in memory
👉 Historical values are persisted in MongoDB
Those features have been available in MonsterMQ for a long time…
The i3x interface just exposes all of that data via the i3x protocol!
💡 This means you get a full MQTT broker with structured, queryable data access via i3x – all in one place.
WhatsApp messages from WinCC Unified
Someone asked me if it’s possible to send WhatsApp messages from WinCC Unified 💬
Yes, and it’s simple! A small Python helper connects to the GraphQL server of WinCC Unified, subscribes to a tag to get the message text, and forwards it to WhatsApp via Twilio. That’s it. And for sure, the same can be done with WinCC Open Architecture.
Available here: https://github.com/vogler75/winccua-twilio
LLM based voice Interaction in WinCC OA!
At our USA Tour, someone asked about voice interaction with WinCC OA – and luckily, I had exactly that showcase in my demo.
I recorded a quick demo (not perfectly, sorry), but it still shows how easy it is to bring LLMs into WinCC OA: capturing voice directly in the browser, sending it to an LLM via simple HTTP REST calls, and letting the system respond or act.
WinCC OA is open and flexible – that’s why use cases like this can be built so quickly.
And excuse the not-so-nice UI – I built it myself 😄
🎥 Check out the short demo!
🧌 New Features in MonsterMQ – Flow Engine & Data Logging!
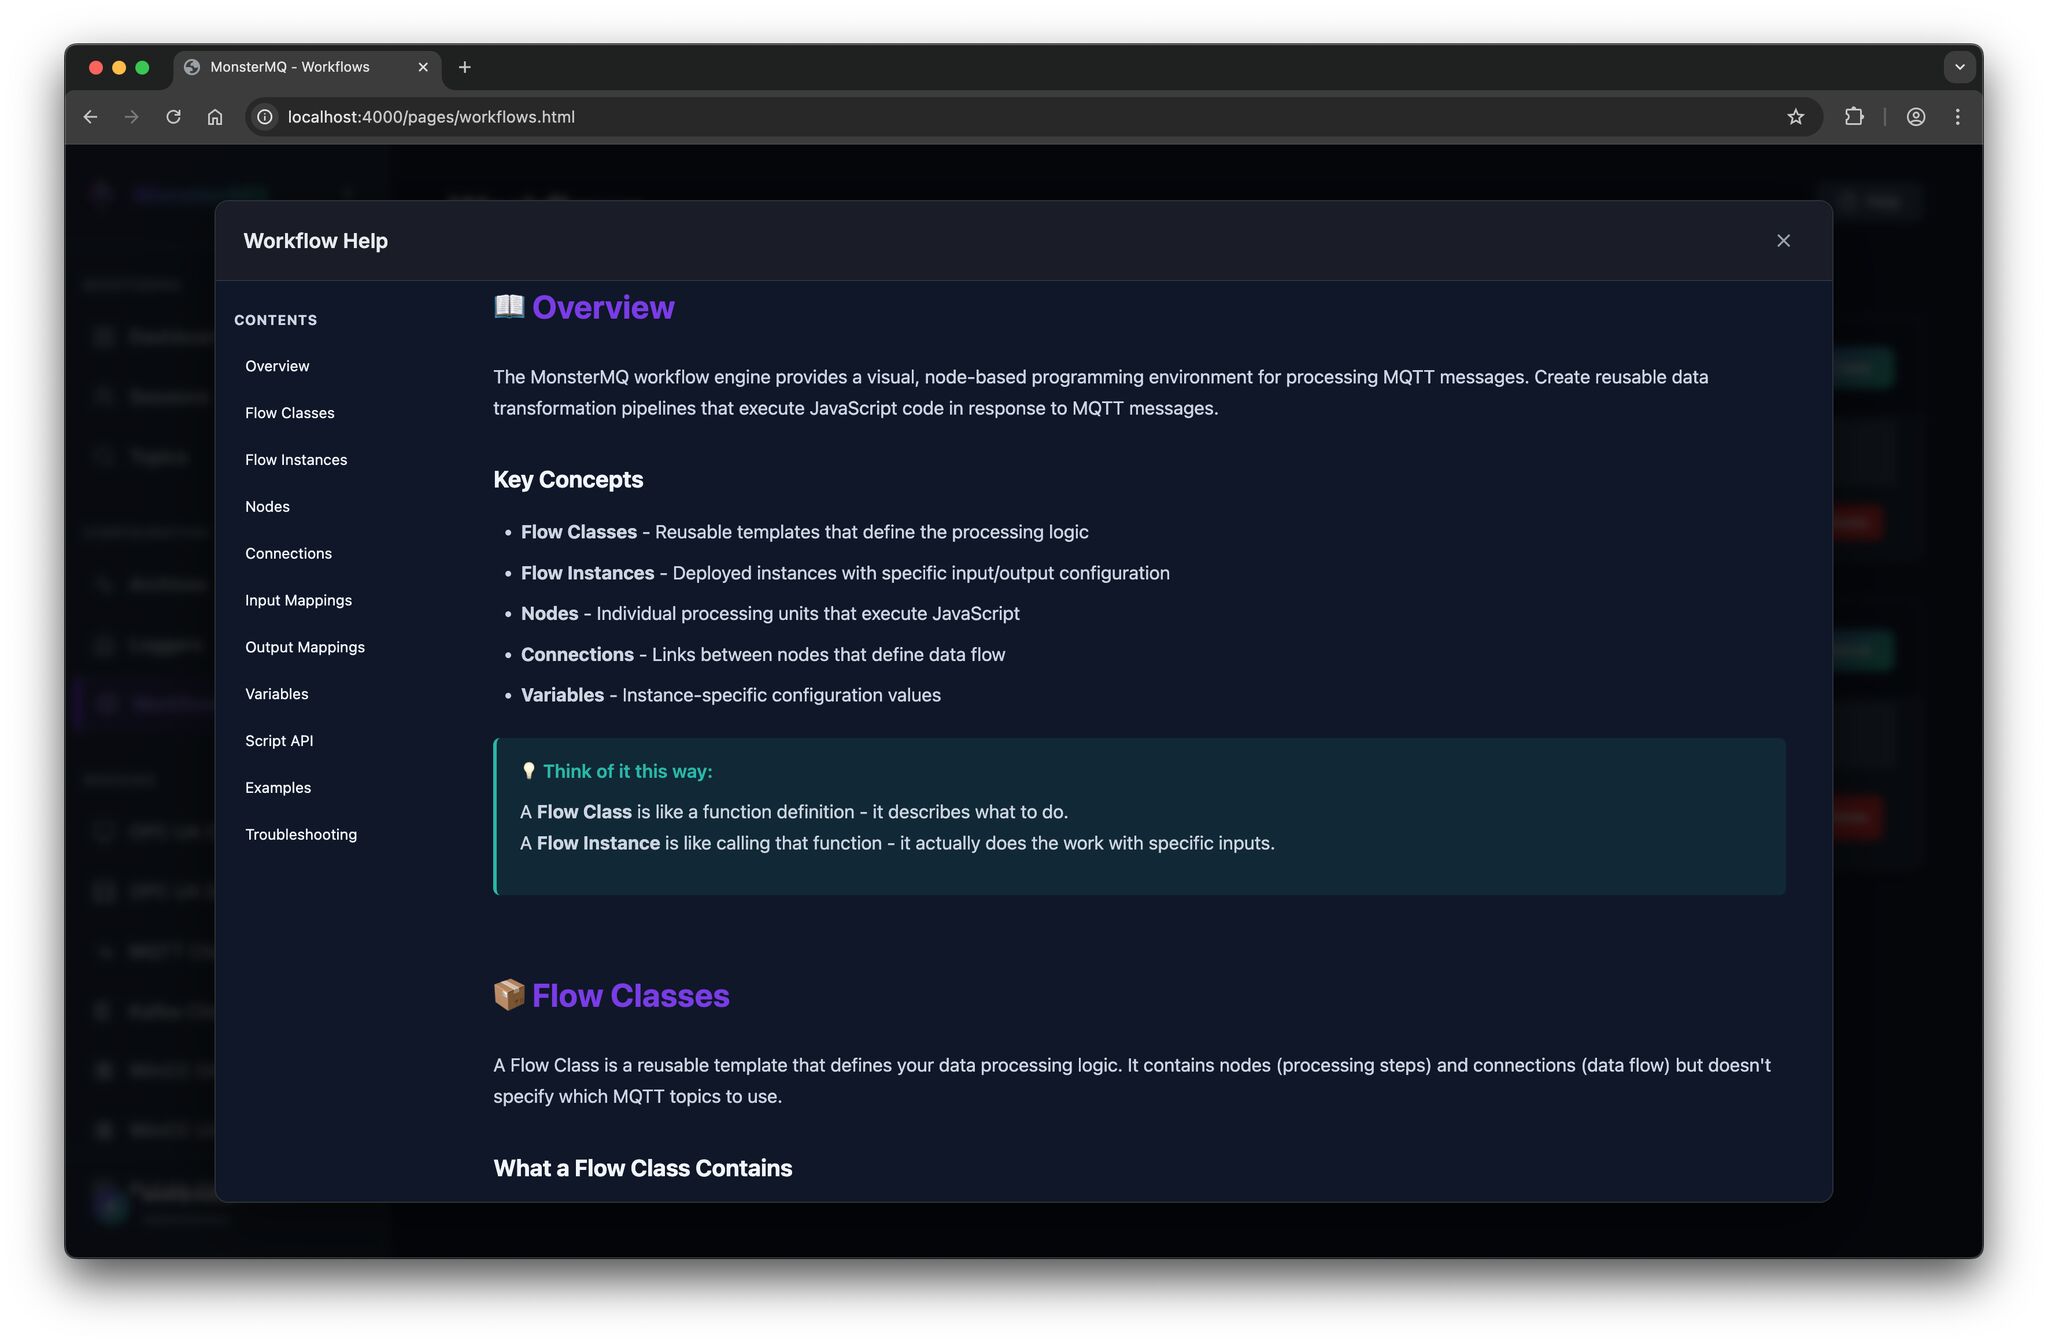
I’ve added a first version a workflow engine that lets you define custom business logic directly inside the broker:
🔹 React on multiple input topics
🔹 Write your logic in JavaScript, more functions
🔹 Publish results to output topics
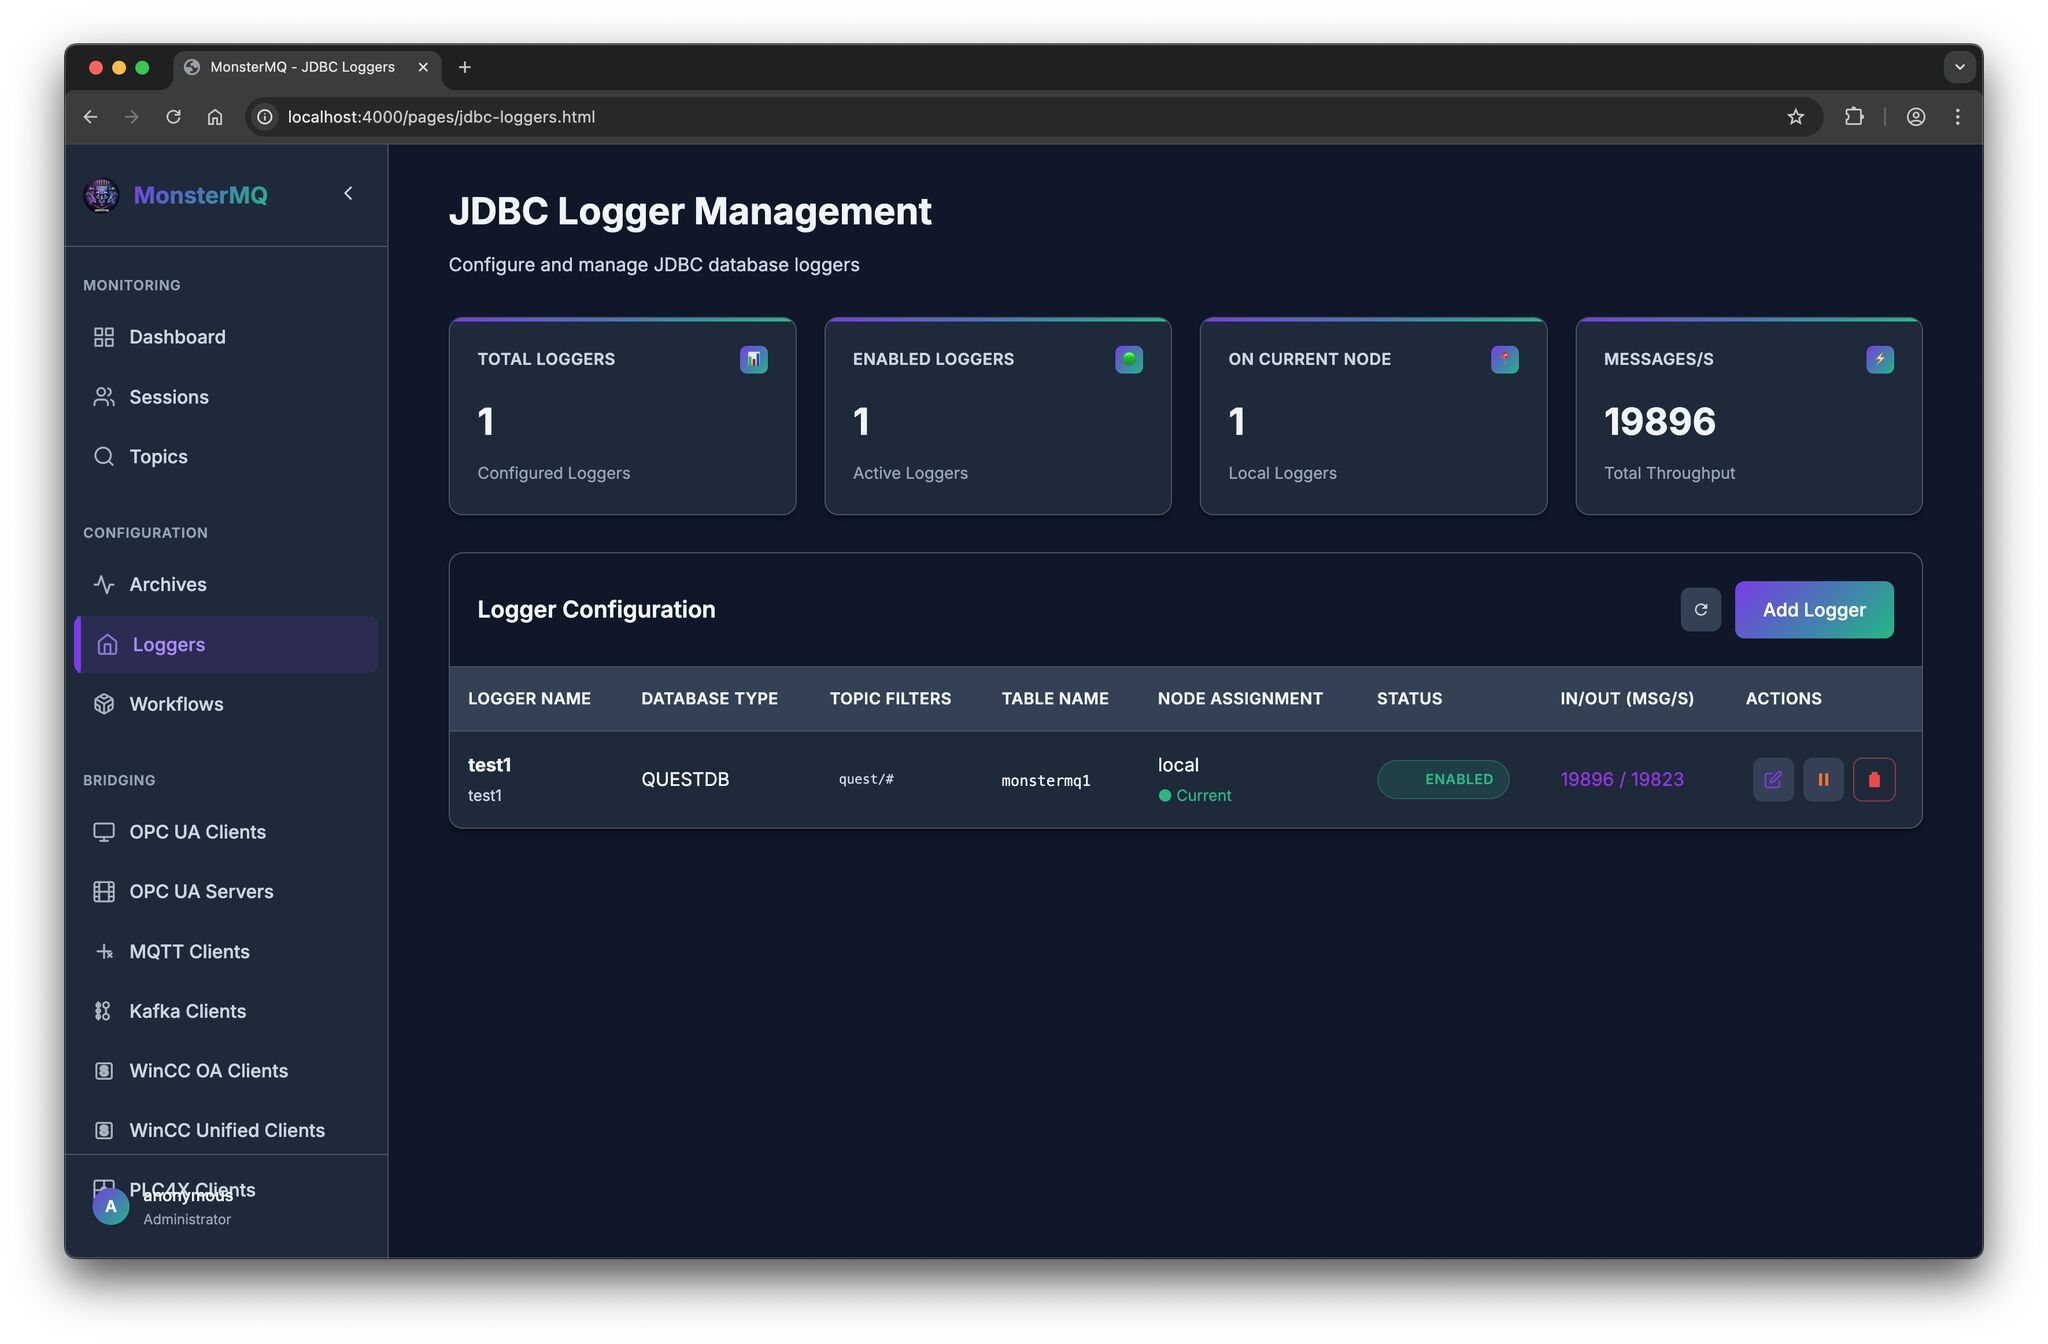
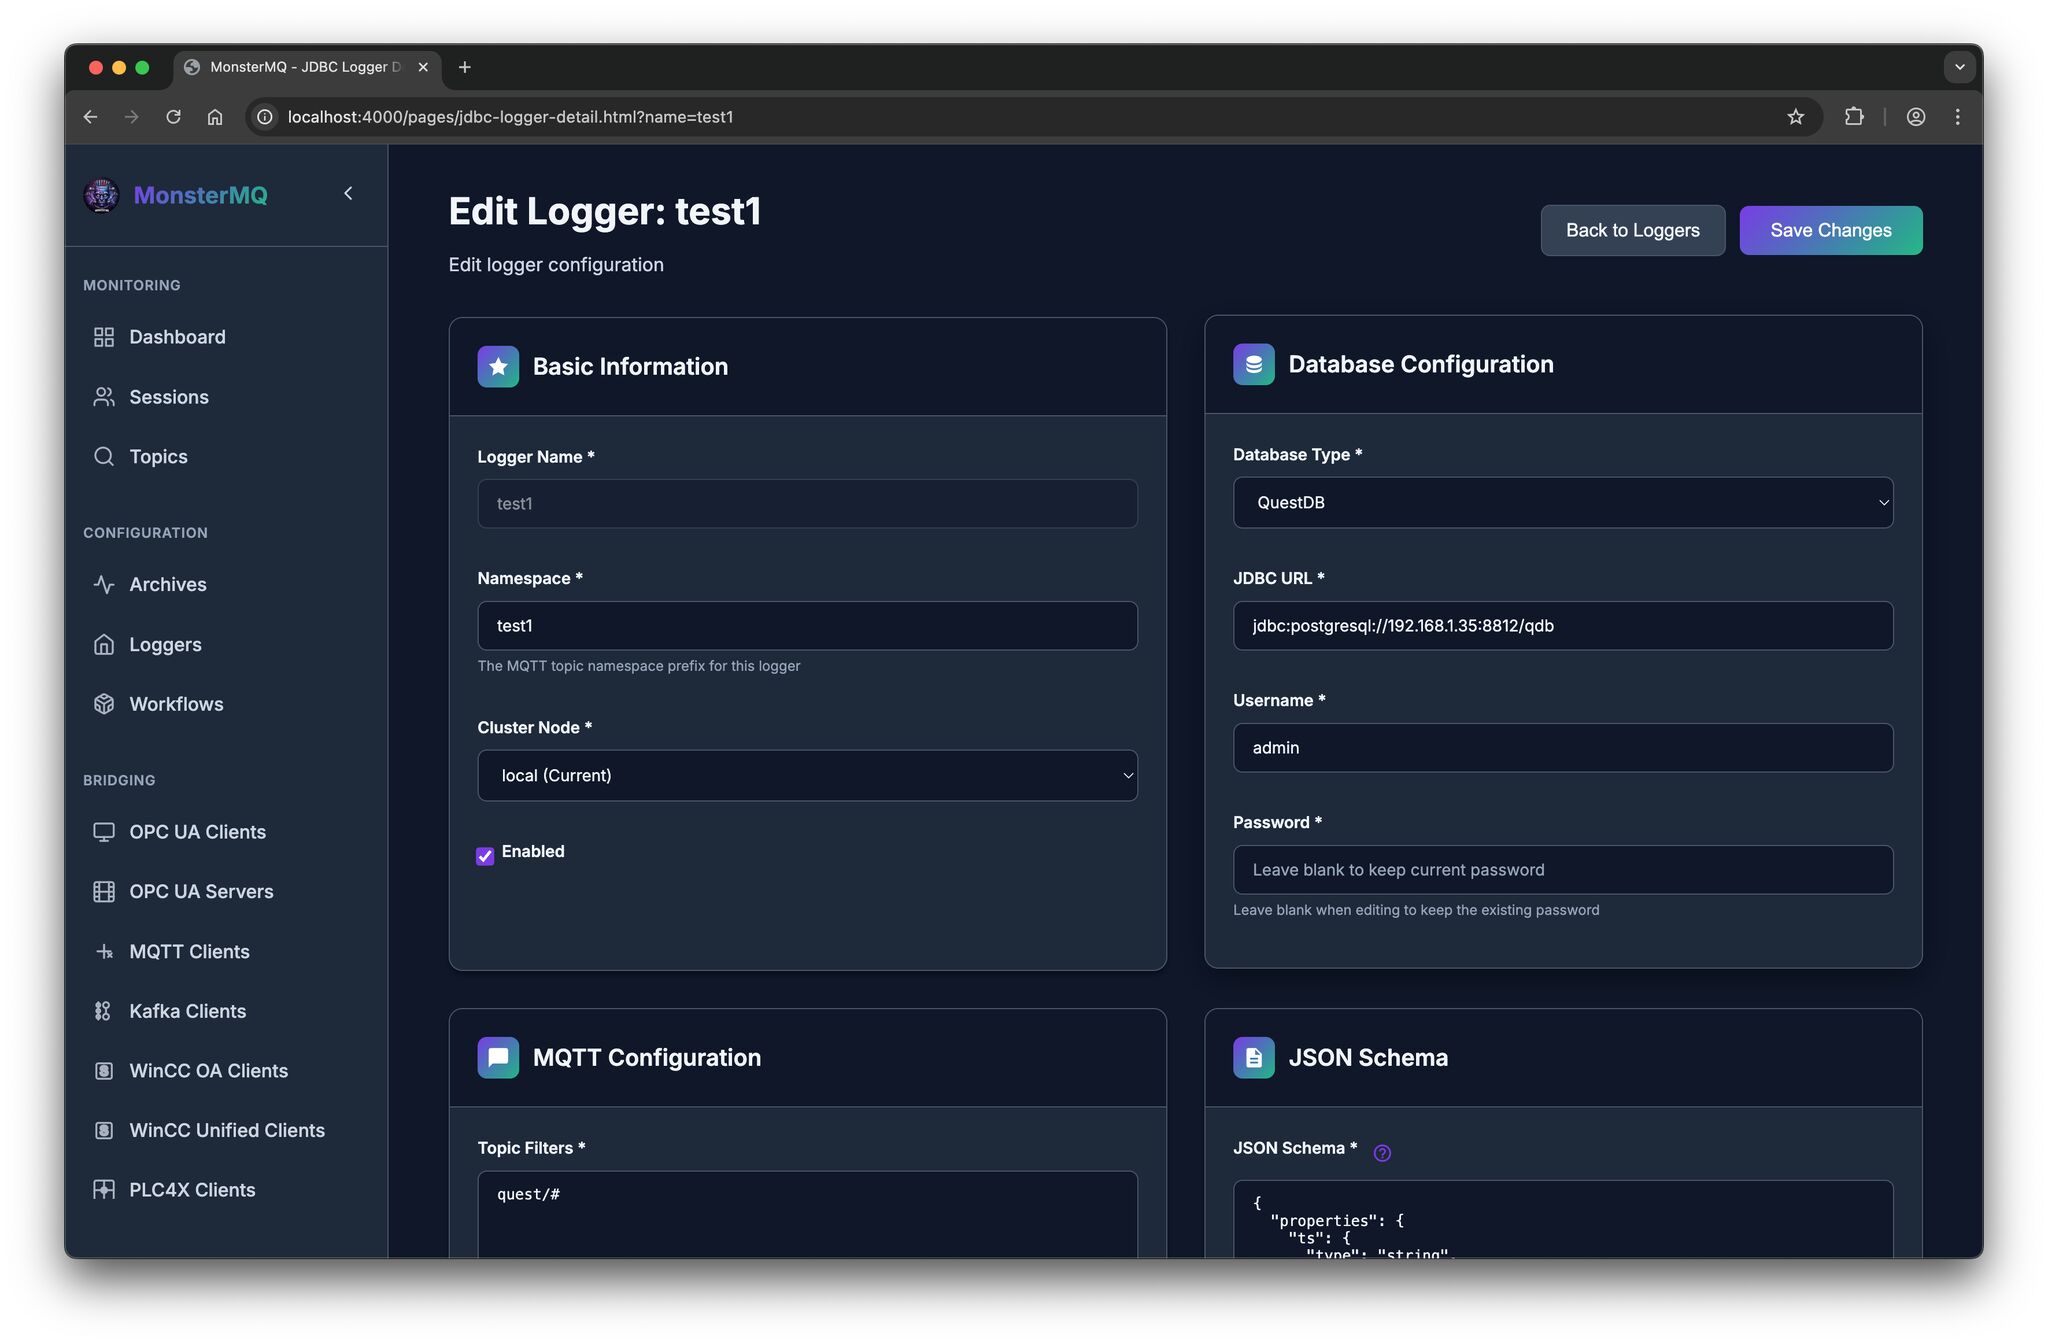
💾 And there is now a JDBC-based Data Logger with store and forward.
It currently supports JSON payloads, with a JSON schema, you can define how fields map to columns in your database tables.
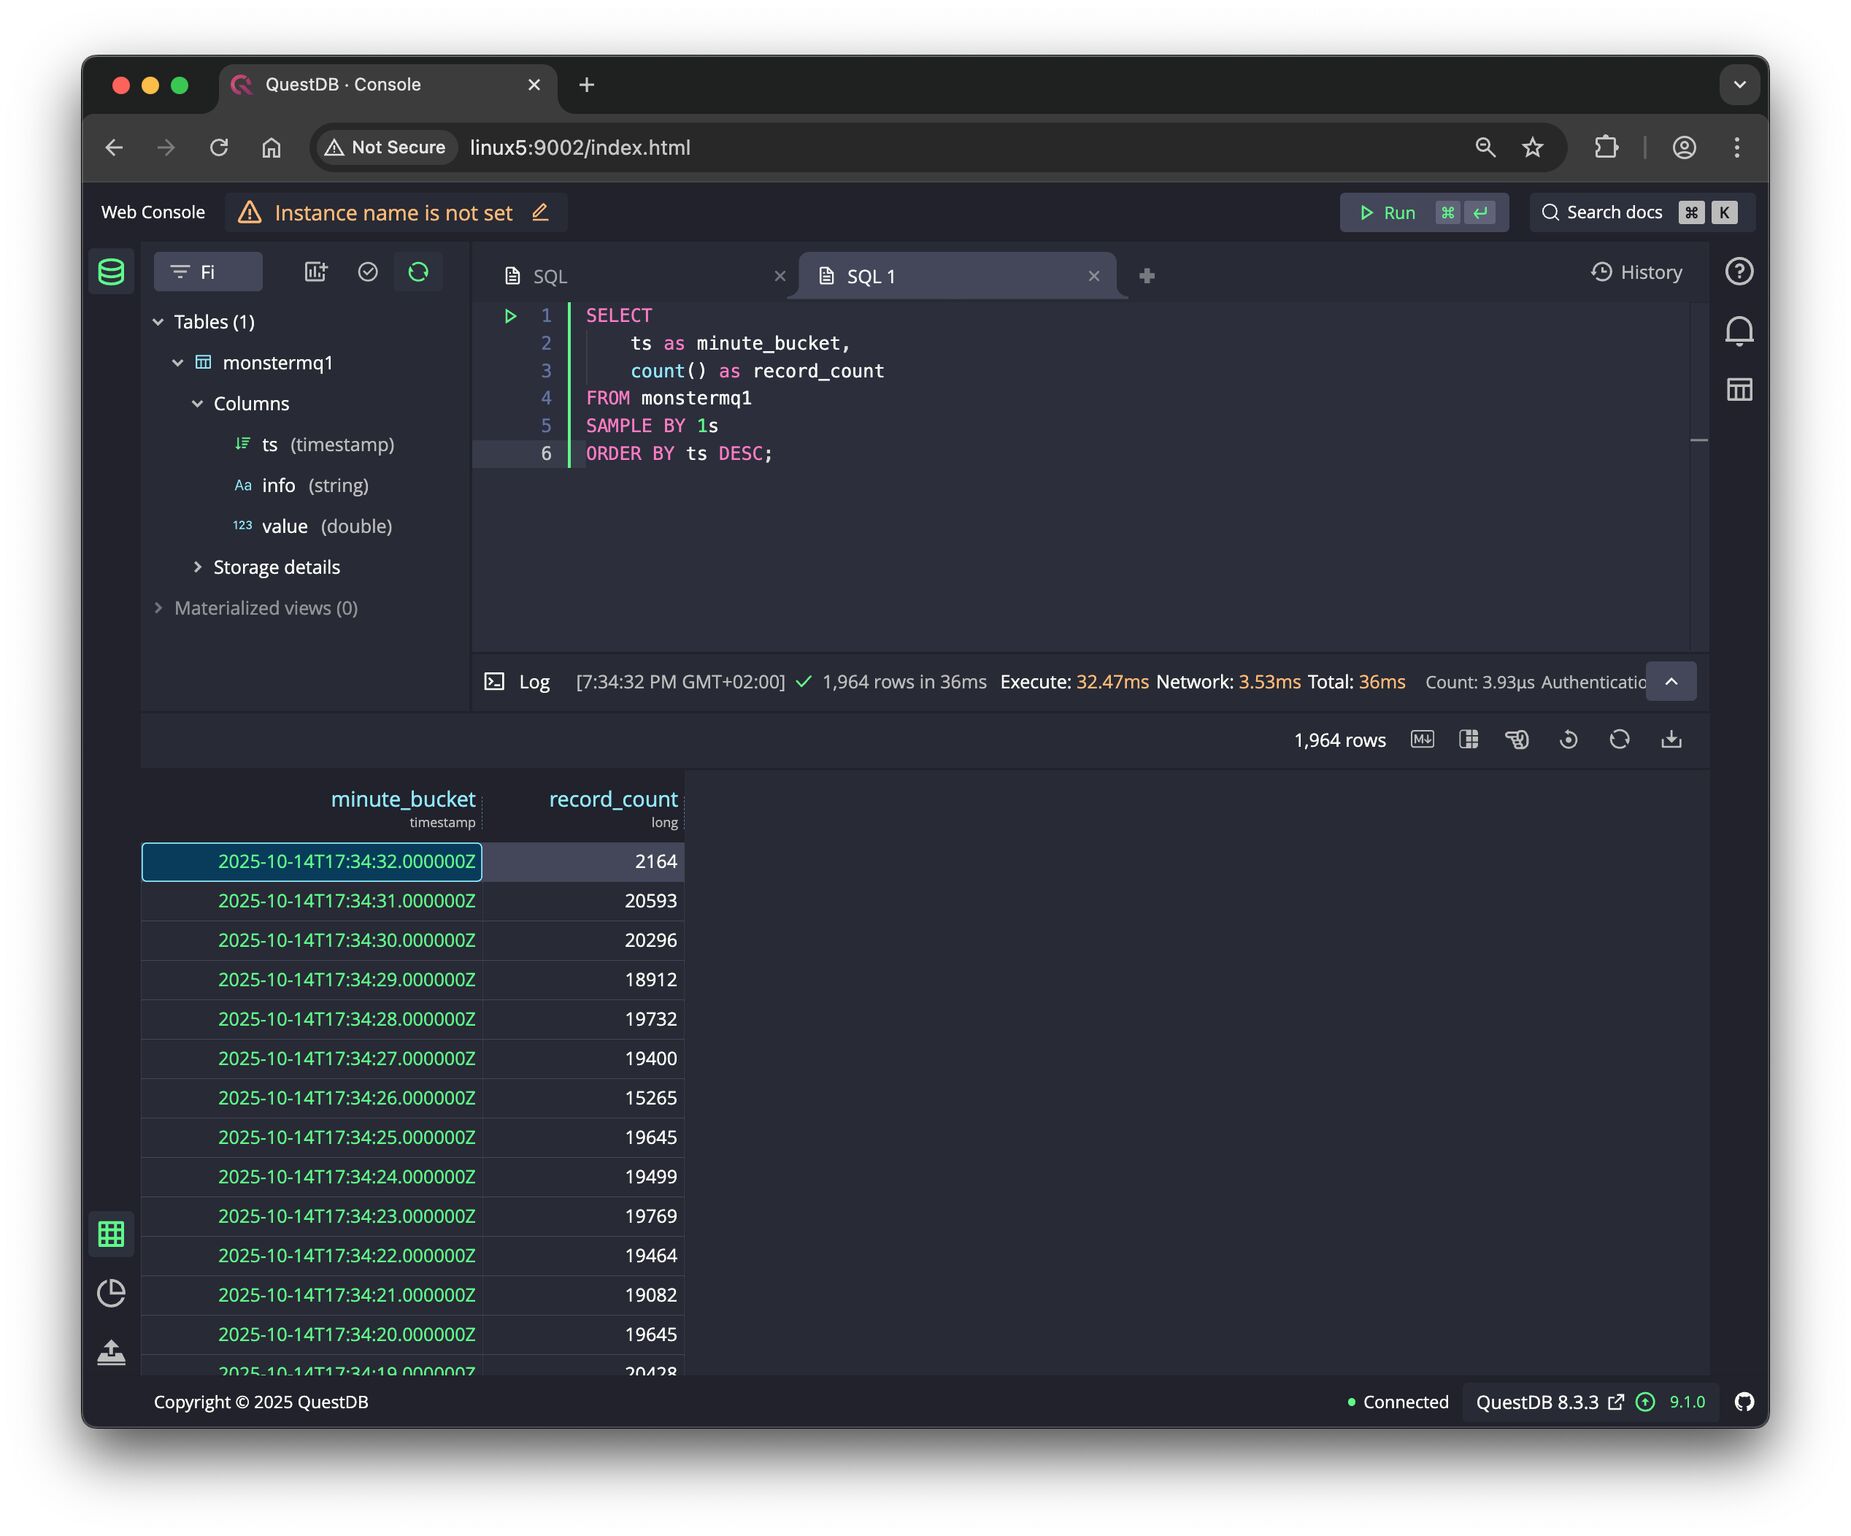
See the pictures, a simple test with 30 Python clients publishing topics to the broker. It stores 20 kHz of data into a QuestDB instance without issues.
It’s a simple way to process and store data where it flows – no need for external services or function frameworks.
👉 MonsterMQ.com 👉 give a star on GitHub if you like it. thx.


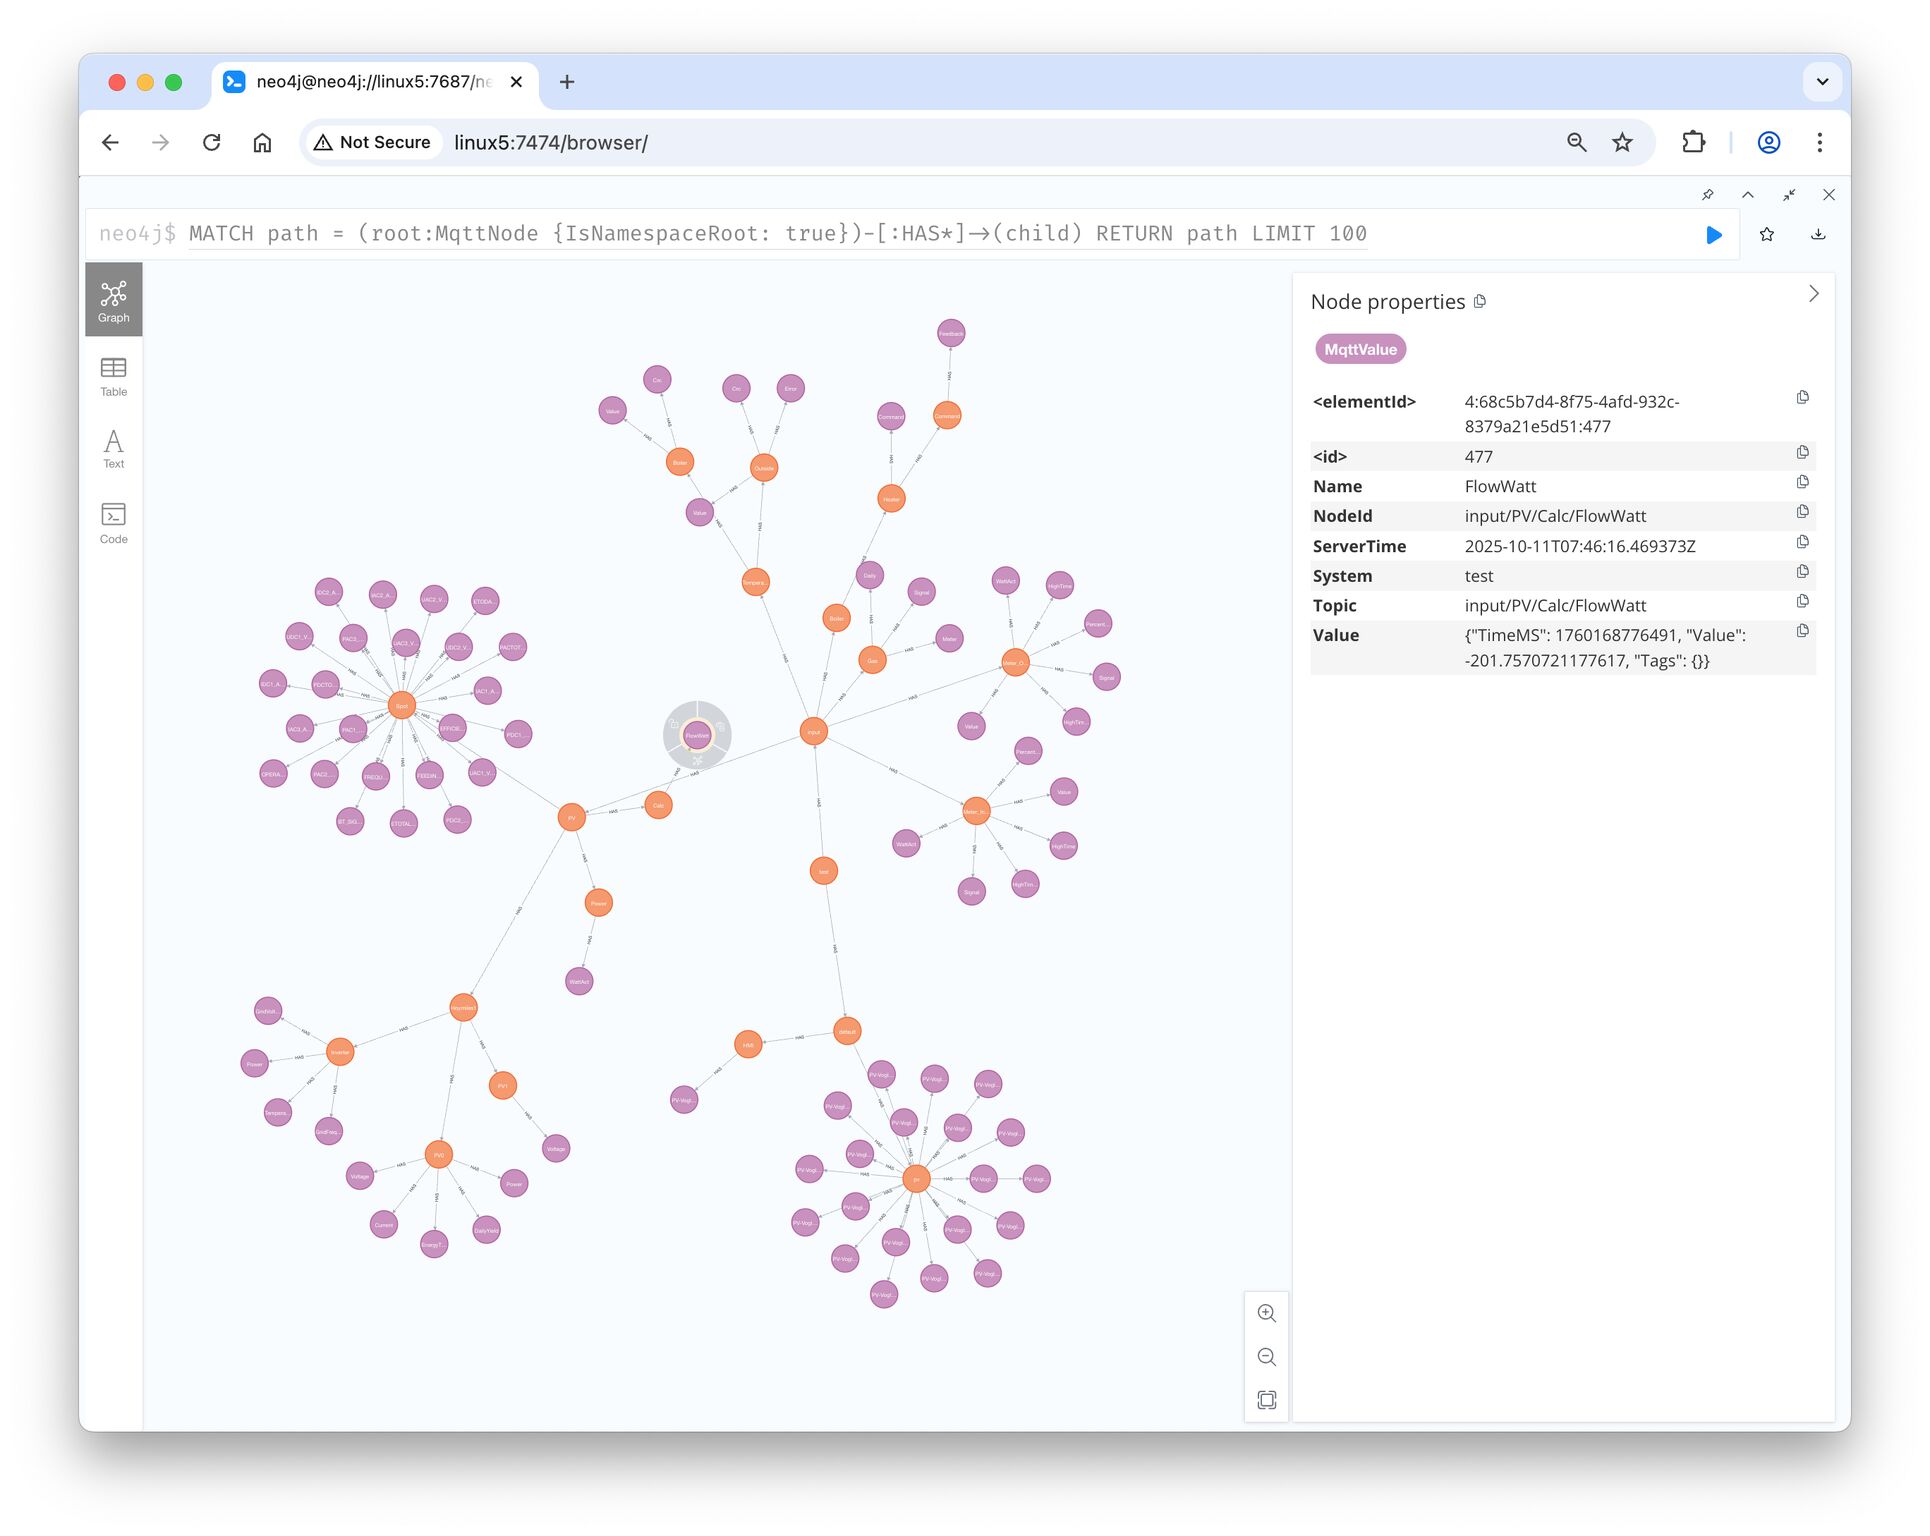
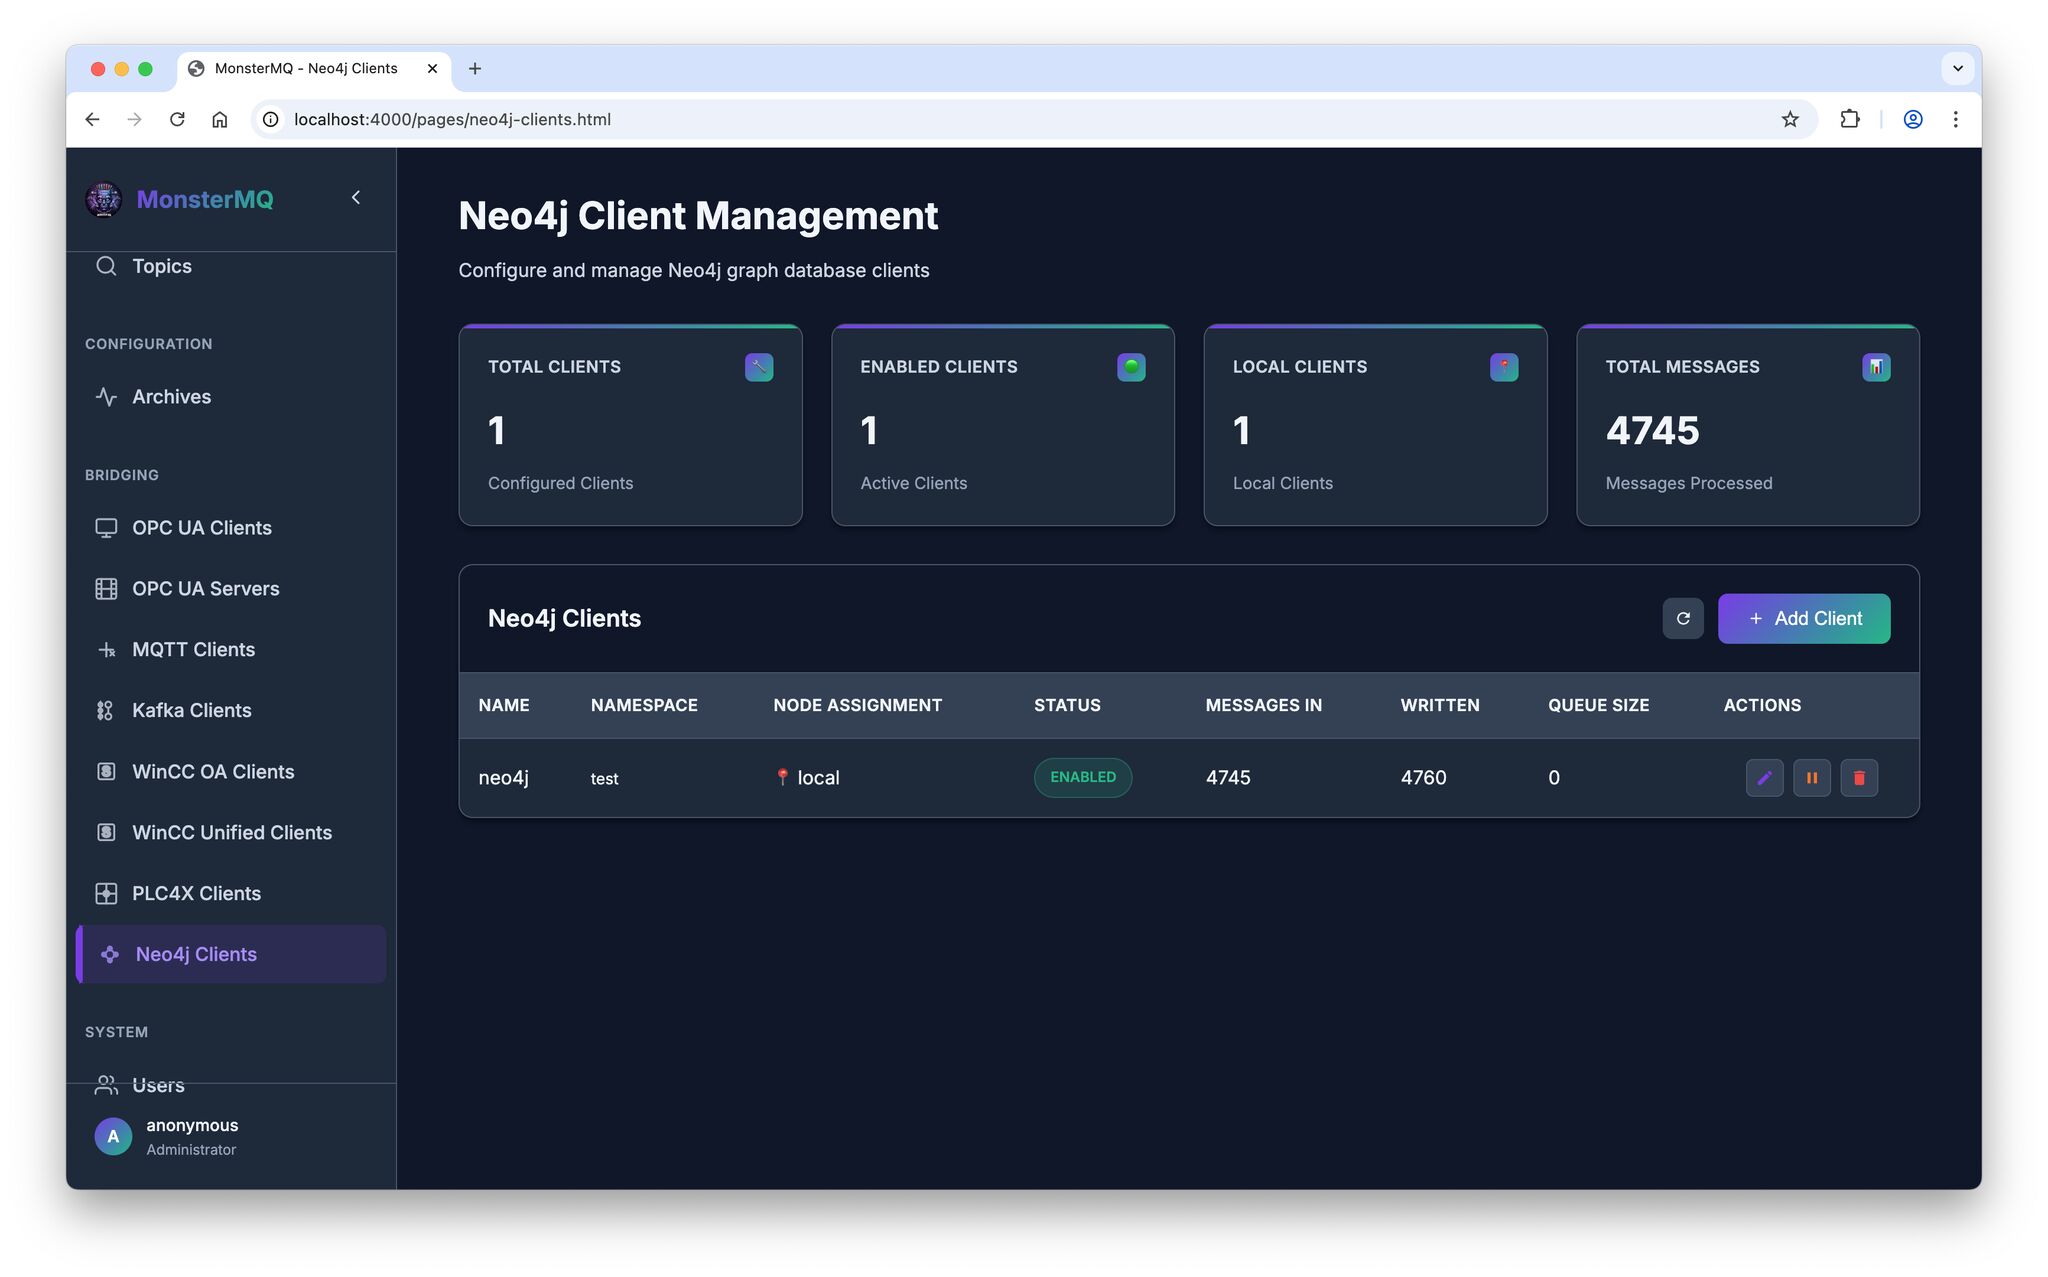
🧌 Weekend Update – MonsterMQ meets Graph Database!
I’ve merged the functionality for bringing MQTT UNS topic trees to Neo4j. Previously part of my Automation-Gateway open source project.
👉 Now, MonsterMQ can push namespaces from the broker into a Neo4j graph database.
💡 Graph databases can help LLMs understand context and relationships better. This integration makes it easy to link your UNS data with other graph data, enriching the context of your factory and process information.
⚠️ But be careful – don’t overload your database with too many writes 😉
👉 MonsterMQ.com 👉 Open-Source!
MonsterMQ ACLs
💬 Yesterday a client asked me:
“Generally, another important element is ACLs — but in a way that I can select topics easier with a GUI instead of using only wildcards, since I need very granular ACLs.”
☕️ I decided to implement it – my date with a lovely woman got canceled today, by her 🤨, so I suddenly had some extra time.
It was straightforward – almost everything in MonsterMQ can be configured through its GraphQL API, so building such a page was easy.
Now, ACL management just got a lot more user-friendly.
⚙️ Next up: I’m working on a lightweight flow engine, so transformations can be implemented directly in the broker – in JavaScript, but still running where the data flows.
👉 MonsterMQ.com
🧩 MonsterMQ – Groundhog Day
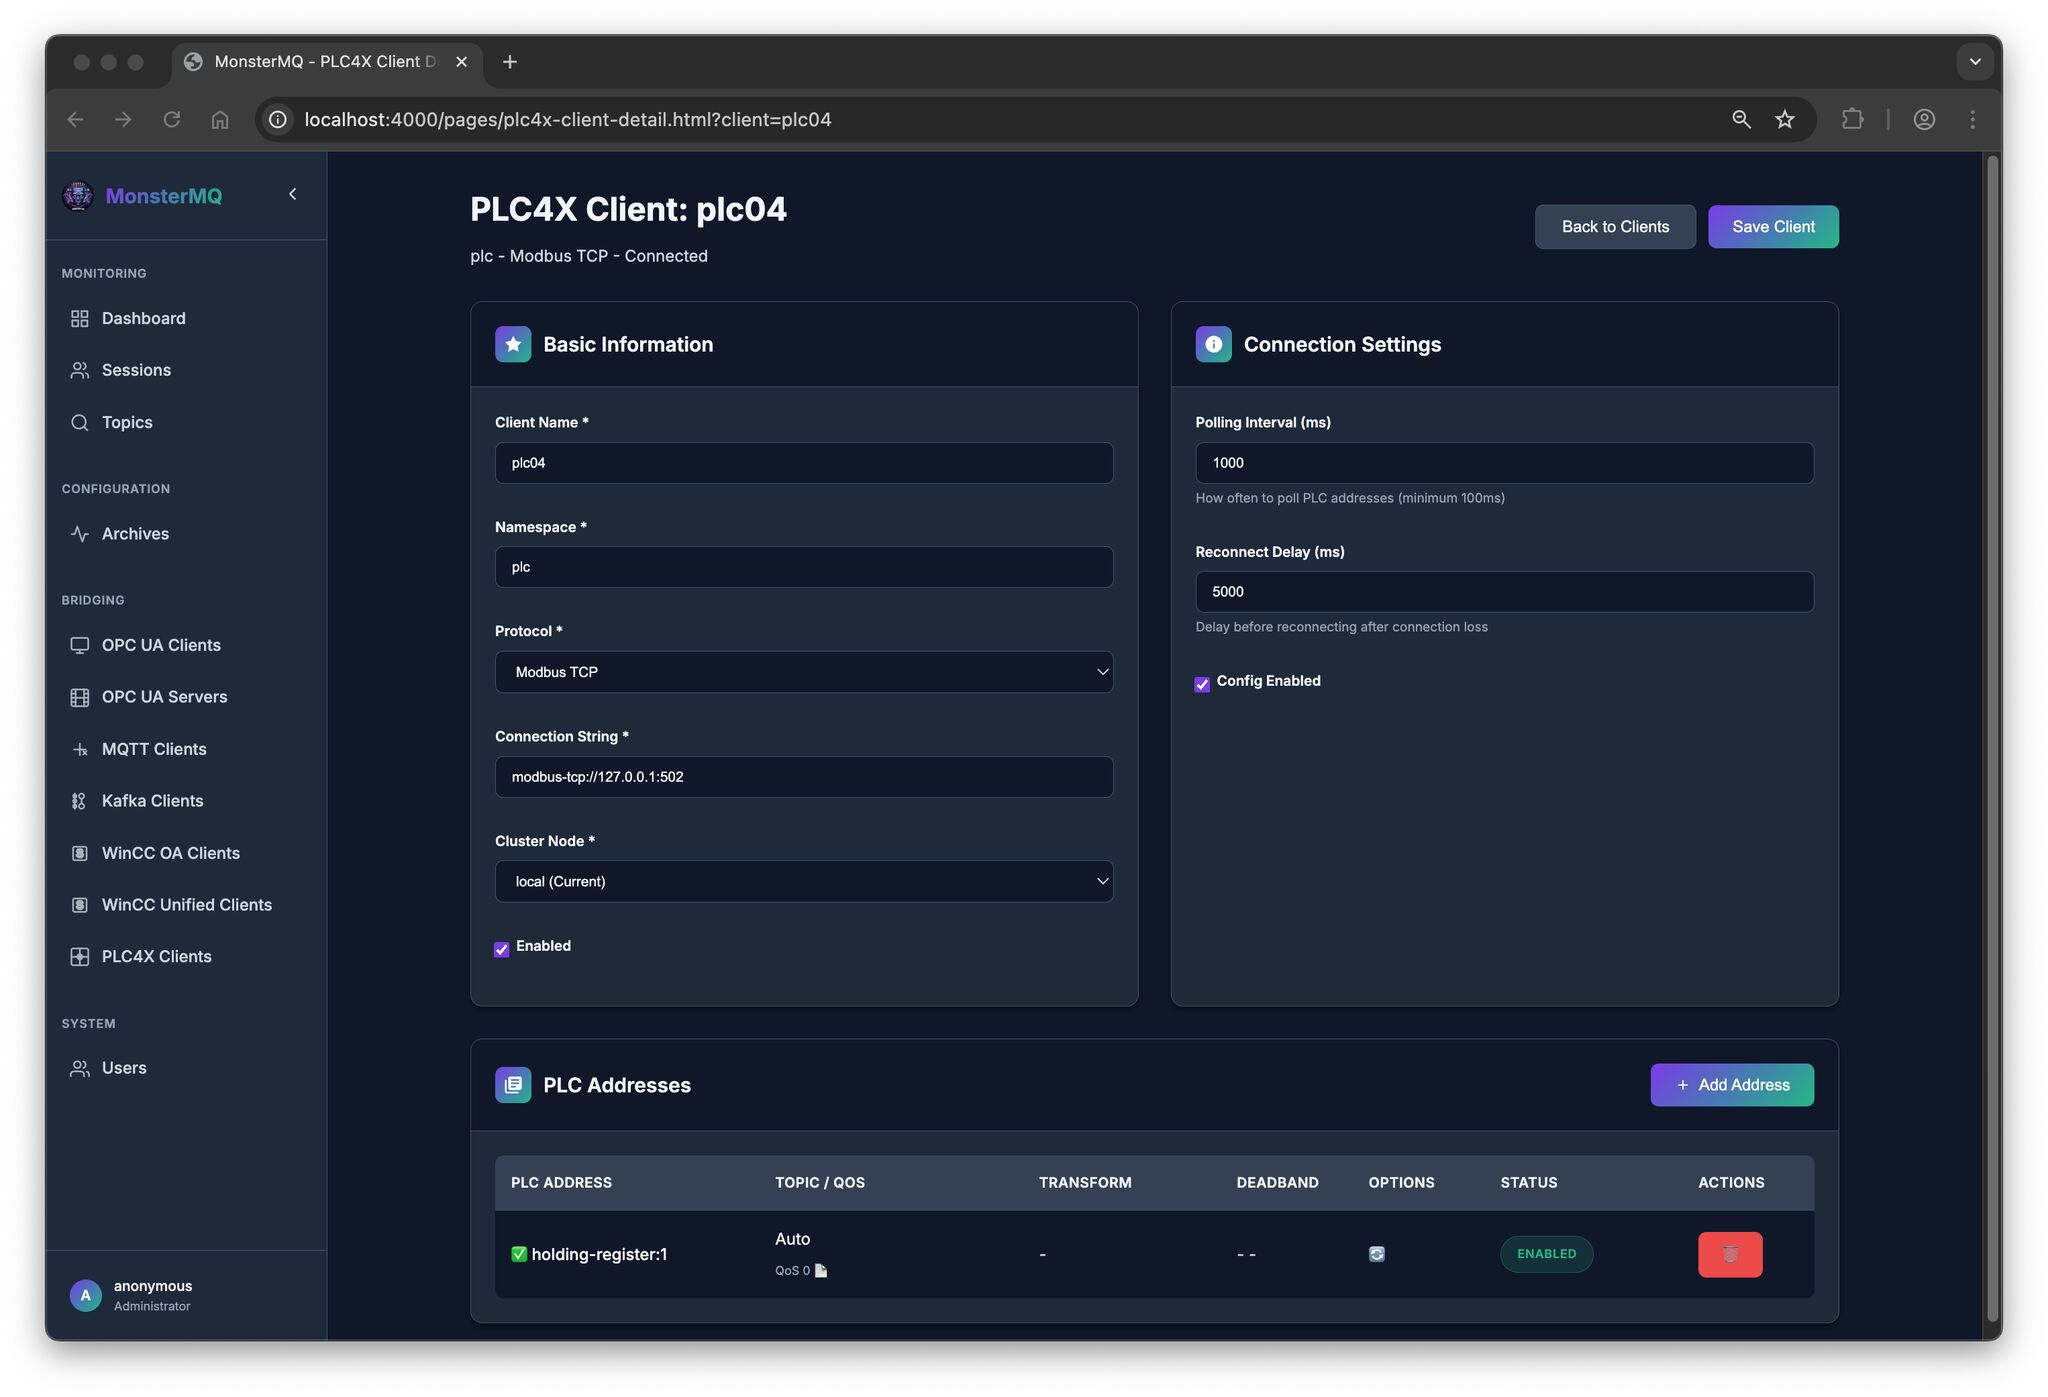
Every day (or night) a new feature – I’ve now added PLC4X
MonsterMQ becomes also a gateway, collecting data from the field to MQTT and can forwarding it to higher layers.
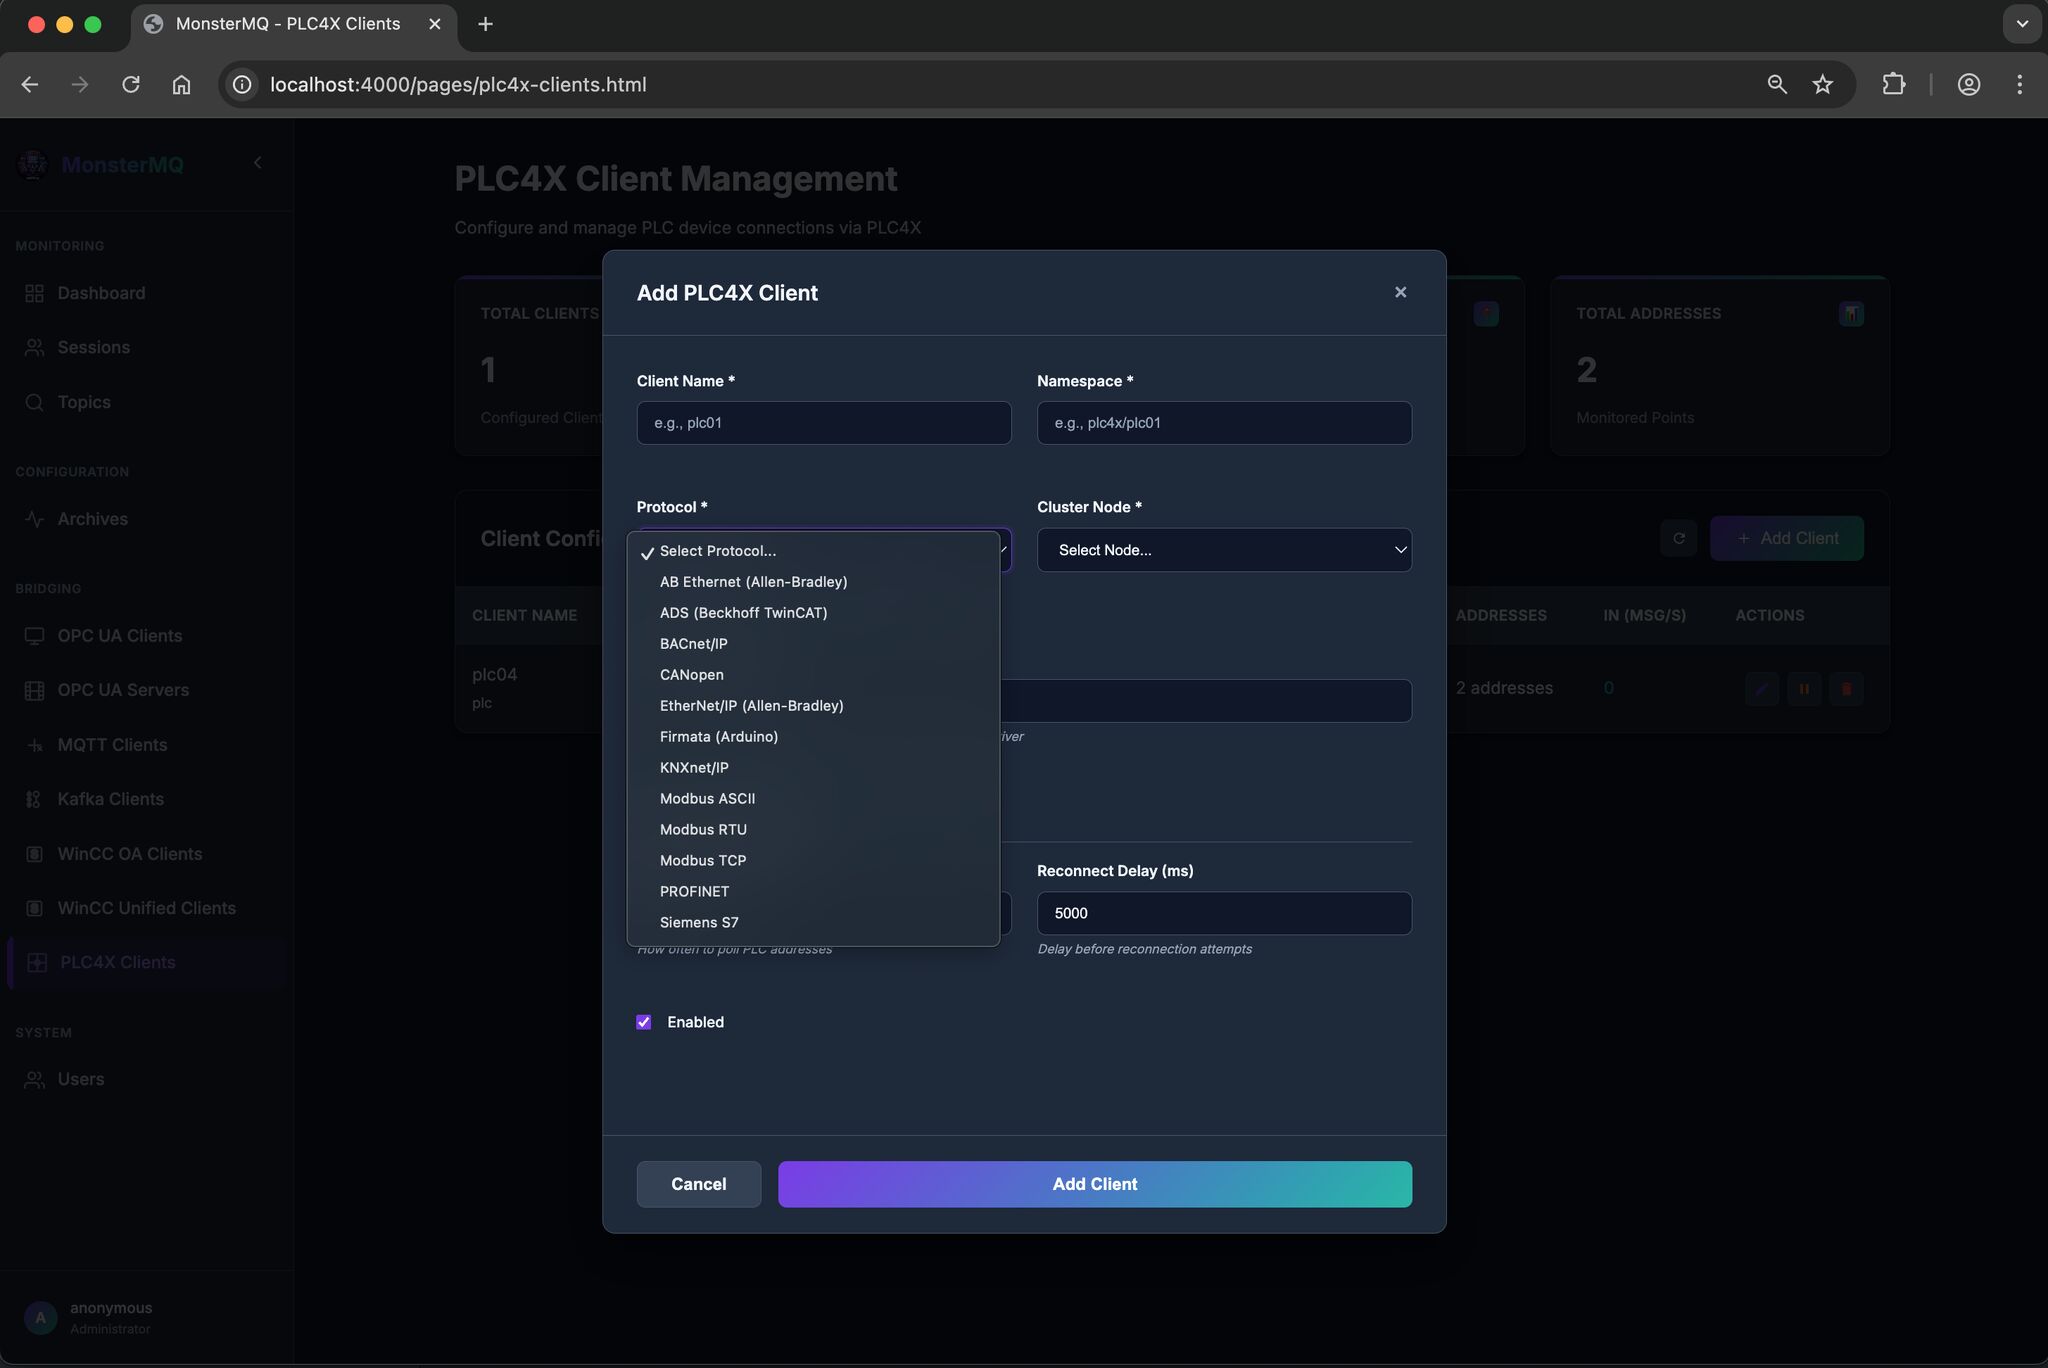
I’ve only tested it with Modbus so far, would be great if others could try it with more PLCs and protocols. See the picture for the list of supported ones.
If you like it, star it on GitHub: MonsterMQ.com